Vodafone 2011 Annual Report Download - page 42
Download and view the complete annual report
Please find page 42 of the 2011 Vodafone annual report below. You can navigate through the pages in the report by either clicking on the pages listed below, or by using the keyword search tool below to find specific information within the annual report.-
 1
1 -
2
-
3
-
4
-
5
-
6
-
7
-
8
-
9
-
10
-
11
-
12
-
13
-
14
-
15
-
16
-
17
-
18
-
19
-
20
-
21
-
22
-
23
-
24
-
25
-
26
-
27
-
28
-
29
-
30
-
31
-
 32
32 -
 33
33 -
 34
34 -
 35
35 -
 36
36 -
 37
37 -
 38
38 -
 39
39 -
 40
40 -
 41
41 -
 42
42 -
 43
43 -
 44
44 -
 45
45 -
 46
46 -
 47
47 -
 48
48 -
 49
49 -
 50
50 -
 51
51 -
 52
52 -
53
-
54
-
55
-
56
-
57
-
58
-
59
-
60
-
61
-
62
-
63
-
64
-
65
-
66
-
67
-
68
-
69
-
70
-
71
-
72
-
73
-
74
-
75
-
76
-
77
-
78
-
79
-
80
-
81
-
82
-
83
-
84
-
85
-
86
-
87
-
88
-
89
-
90
-
91
-
92
-
93
-
94
-
95
-
96
-
97
-
98
-
99
-
100
-
101
-
102
-
103
-
104
-
105
-
106
-
107
-
108
-
109
-
110
-
111
-
112
-
113
-
114
-
115
-
116
-
117
-
118
-
119
-
120
-
121
-
122
-
123
-
124
-
125
-
126
-
127
-
128
-
129
-
130
-
131
-
132
-
133
-
134
-
135
-
136
-
137
-
138
-
139
-
140
-
141
-
142
-
143
-
144
-
145
-
146
-
147
-
148
-
149
-
150
-
151
-
152
-
153
-
154
-
155
-
156
 |
 |

40 Vodafone Group Plc Annual Report 2011
Operating results continued
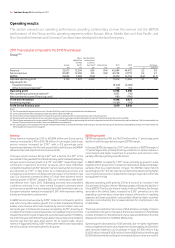
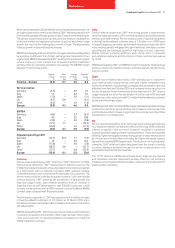
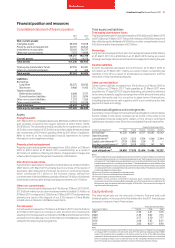
Net financing costs
2010 2009
£m £m
Investment income 716 795
Financing costs (1,512) (2,419)
Net financing costs (796) (1,624)
Analysed as:
Net financing costs before dividends
from investments (1,024) (1,480)
Potential interest charges arising on
settlement
of outstanding tax issues(1) (23) 81
Dividends from investments 145 110
Foreign exchange(2) (1) 235
Equity put rights and similar arrangements(3) (94) (570)
Interest on settlement of German tax claim(4) 201 –
(796) (1,624)
Notes:
(1) Excluding interest on settlement of German tax claim.
(2) Comprises foreign exchange differences reflected in the income statement in relation to certain
intercompany balances and the foreign exchange differences on financial instruments received
as consideration in the disposal of Vodafone Japan to SoftBank in April 2006.
(3) Primarily represents foreign exchange movements and accretion expense. Further details of
these options are provided on page 51.
(4) See “Taxation” below for further details.
Net financing costs before dividends from investments decreased from
£1,480 million to £1,024 million primarily due to the impact of significantly
lower interest rates given our preference for floating rate borrowing,
partially offset by the 13.4% increase in average net debt being offset by
changes in the currency mix of debt. At 31 March 2010 the provision for
potential interest charges arising on settlement of outstanding tax issues
was £1,312 million (31 March 2009: £1,635 million).
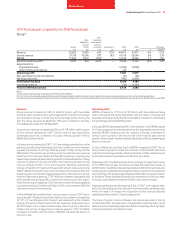
Taxation
The effective tax rate was 0.6% (2009: 26.5%). This rate was lower than our
weighted average statutory tax rate principally due to the impact of the
agreement of the German write down losses (see note 6 to the consolidated
financial statements) and also the ongoing benefits from our internal
capital structure.
Income tax expense includes a credit of £2,103 million arising from the
German tax authorities’ decision that €15 billion of losses booked by a
German subsidiary in 2001 are tax deductible. The credit includes benefits
claimed in respect of prior years as well as the recognition of a deferred tax
asset for the potential use of losses in future tax years.
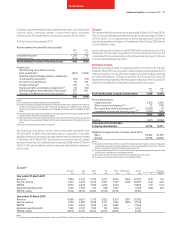
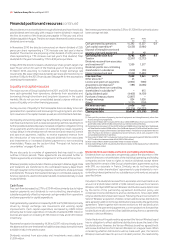
Earnings per share
Adjusted earnings per share decreased by 6.2% to 16.11 pence for the year
ended 31 March 2010 due the prior year tax benefit discussed above. Basic
earnings per share increased to 16.44 pence primarily due to the impairment
losses of £5,900 million in relation to Spain, Turkey and Ghana in the prior
year compared to net impairment losses of £2,100 million in 2010 and the
income tax credit arising from the German tax settlement discussed above.
2010 2009
£m £m
Profit attributable to equity shareholders 8,645 3,078
Pre-tax adjustments:
Impairment losses, net 2,100 5,900
Other income and expense (114) –
Non-operating income and expense 10 44
Investment income and financing costs(1) (106) 335
1,890 6,279
Taxation (2,064) (300)
Adjusted profit attributable to equity
shareholders 8,471 9,057
Weighted average number of shares outstanding Million Million
Basic 52,595 52,737
Diluted 52,849 52,969
Note:
(1) See notes 1 and 2 in “Net financing costs” to the left.
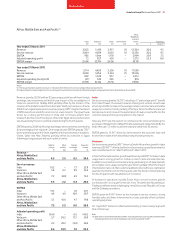
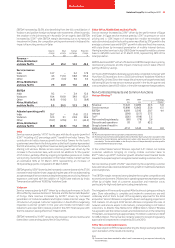
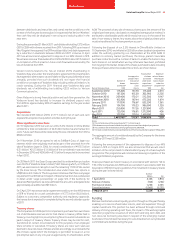
Europe
Germany Italy Spain UK Other Eliminations Europe % change
£m £m £m £m £m £m £m £ Organic
Year ended 31 March 2010
Revenue 8,008 6,027 5,713 5,025 8,357 (297) 32,833 0.2 (4.5)
Service revenue 7,722 5,780 5,298 4,711 7,943 (295) 31,159 0.9 (3.8)
EBITDA 3,122 2,843 1,956 1,141 2,582 – 11,644 (3.9) (8.9)
Adjusted operating profit 1,695 2,107 1,310 155 1,084 – 6,351 (7.0) (12.6)
EBITDA margin 39.0% 47.2% 34.2% 22.7% 30.9% 35.5%
Year ended 31 March 2009
Revenue 7,847 5,547 5,812 5,392 8,514 (343) 32,769
Service revenue 7,535 5,347 5,356 4,912 8,070 (343) 30,877
EBITDA 3,225 2,565 2,034 1,368 2,920 – 12,112
Adjusted operating profit 1,835 1,839 1,421 328 1,406 – 6,829
EBITDA margin 41.1% 46.2% 35.0% 25.4% 34.3% 37.0%