Vodafone 2011 Annual Report Download - page 100
Download and view the complete annual report
Please find page 100 of the 2011 Vodafone annual report below. You can navigate through the pages in the report by either clicking on the pages listed below, or by using the keyword search tool below to find specific information within the annual report.-
 1
1 -
2
-
3
-
4
-
5
-
6
-
7
-
8
-
9
-
10
-
11
-
12
-
13
-
14
-
15
-
16
-
17
-
18
-
19
-
20
-
21
-
22
-
23
-
24
-
25
-
26
-
27
-
28
-
29
-
30
-
31
-
32
-
33
-
34
-
35
-
36
-
37
-
38
-
39
-
40
-
41
-
42
-
43
-
44
-
45
-
46
-
47
-
48
-
49
-
50
-
51
-
52
-
53
-
54
-
55
-
56
-
57
-
58
-
59
-
60
-
61
-
62
-
63
-
64
-
65
-
66
-
67
-
68
-
69
-
70
-
71
-
72
-
73
-
74
-
75
-
76
-
77
-
78
-
79
-
80
-
81
-
82
-
83
-
84
-
85
-
86
-
87
-
88
-
89
-
 90
90 -
 91
91 -
 92
92 -
 93
93 -
 94
94 -
 95
95 -
 96
96 -
 97
97 -
 98
98 -
 99
99 -
 100
100 -
 101
101 -
 102
102 -
 103
103 -
 104
104 -
 105
105 -
 106
106 -
 107
107 -
 108
108 -
 109
109 -
 110
110 -
111
-
112
-
113
-
114
-
115
-
116
-
117
-
118
-
119
-
120
-
121
-
122
-
123
-
124
-
125
-
126
-
127
-
128
-
129
-
130
-
131
-
132
-
133
-
134
-
135
-
136
-
137
-
138
-
139
-
140
-
141
-
142
-
143
-
144
-
145
-
146
-
147
-
148
-
149
-
150
-
151
-
152
-
153
-
154
-
155
-
156
 |
 |

98 Vodafone Group Plc Annual Report 2011
Notes to the consolidated nancial statements continued
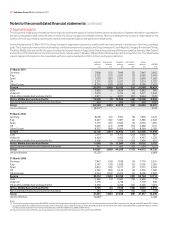
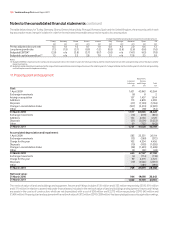
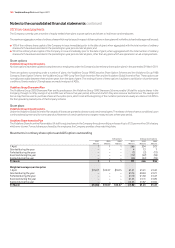
10. Impairment
Impairment losses
The net impairment losses recognised in the consolidated income statement, as a separate line item within operating profit, in respect of goodwill and
licences and spectrum fees are as follows:
2011(1) 2010 2009
Cash generating unit Reportable segment £m £m £m
Italy Italy 1,050 – –
Spain Spain 2,950 – 3,400
Greece Other Europe(2) 800 – –
Ireland Other Europe(2) 1,000 – –
Portugal Other Europe(2) 350 – –
Turkey Other Europe – (200) 2,250
India India – 2,300 –
Ghana Other Africa, Middle East and Asia Pacific – – 250
6,150 2,100 5,900
Notes:
(1) Impairment charges for the year ended 31 March 2011 relate solely to goodwill.
(2) Total impairment losses in the Other Europe segment were £2,150 million in the year ended 31 March 2011.
Year ended 31 March 2011
The impairment losses were based on value in use calculations. The pre-tax adjusted discount rates used in the most recent value in use calculation in the
year ended 31 March 2011 are as follows:
Pre-tax adjusted
discount rate
Italy 11.9%
Spain 11.5%
Greece 14.0%
Ireland 14.5%
Portugal 14.0%
During the year ended 31 March 2011 the goodwill in relation to the Group’s investments in Italy, Spain, Greece, Ireland and Portugal was impaired by
£1,050 million, £2,950 million, £800 million, £1,000 million and £350 million, respectively. The impairment charges were primarily driven by increased
discount rates as a result of increases in government bond rates. In addition, business valuations were negatively impacted by lower cash flows within
business plans, reflecting weaker country-level macro economic environments.
The pre-tax risk adjusted discount rates used in the previous value in use calculations at 31 March 2010 are disclosed below.
Year ended 31 March 2010
The net impairment losses were based on value in use calculations. The pre-tax adjusted discount rates used in the value in use calculation in the year
ended 31 March 2010 were as follows:
Pre-tax adjusted
discount rate
India 13.8%
Turkey 17.6%