Vodafone 2011 Annual Report Download - page 84
Download and view the complete annual report
Please find page 84 of the 2011 Vodafone annual report below. You can navigate through the pages in the report by either clicking on the pages listed below, or by using the keyword search tool below to find specific information within the annual report.-
 1
1 -
2
-
3
-
4
-
5
-
6
-
7
-
8
-
9
-
10
-
11
-
12
-
13
-
14
-
15
-
16
-
17
-
18
-
19
-
20
-
21
-
22
-
23
-
24
-
25
-
26
-
27
-
28
-
29
-
30
-
31
-
32
-
33
-
34
-
35
-
36
-
37
-
38
-
39
-
40
-
41
-
42
-
43
-
44
-
45
-
46
-
47
-
48
-
49
-
50
-
51
-
52
-
53
-
54
-
55
-
56
-
57
-
58
-
59
-
60
-
61
-
62
-
63
-
64
-
65
-
66
-
67
-
68
-
69
-
70
-
71
-
72
-
73
-
 74
74 -
 75
75 -
 76
76 -
 77
77 -
 78
78 -
 79
79 -
 80
80 -
 81
81 -
 82
82 -
 83
83 -
 84
84 -
 85
85 -
 86
86 -
 87
87 -
 88
88 -
 89
89 -
 90
90 -
 91
91 -
 92
92 -
 93
93 -
 94
94 -
95
-
96
-
97
-
98
-
99
-
100
-
101
-
102
-
103
-
104
-
105
-
106
-
107
-
108
-
109
-
110
-
111
-
112
-
113
-
114
-
115
-
116
-
117
-
118
-
119
-
120
-
121
-
122
-
123
-
124
-
125
-
126
-
127
-
128
-
129
-
130
-
131
-
132
-
133
-
134
-
135
-
136
-
137
-
138
-
139
-
140
-
141
-
142
-
143
-
144
-
145
-
146
-
147
-
148
-
149
-
150
-
151
-
152
-
153
-
154
-
155
-
156
 |
 |

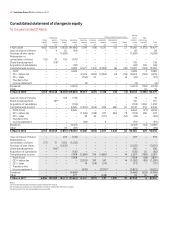
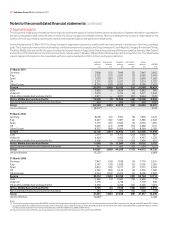
82 Vodafone Group Plc Annual Report 2011
for the years ended 31 March
Equity
Additional Other comprehensive income share- Non-
Share paid-in Treasury Retained Currency Pensions Investment Revaluation holders’ controlling
capital capital(1) shares losses reserve reserve reserve surplus Other funds interests Total
£m £m £m £m £m £m £m £m £m £m £m £m
1 April 2008 4,182 153,139 (7,856) (81,980) 5,974 (96) 4,531 112 37 78,043 (1,572) 76,471
Issue or reissue of shares 3 4 65 (44) – – – – – 28 – 28
Purchase of own shares – – (1,000) – – – – – – (1,000) – (1,000)
Redemption or
cancellation of shares (32) 47 755 (770) – – – – – – – –
Share-based payment – 158(2) – – – – – – – 158 – 158
Acquisition of subsidiaries – – – (87) – – – – – (87) 436 349
Comprehensive income – – – 3,078 12,477 (163) (2,383) 68 (40) 13,037 (103) 12,934
Profit – – – 3,078 – – – – – 3,078 2 3,080
OCI – before tax – – – – 12,614 (220) (2,383) 68 (56) 10,023 (105) 9,918
OCI – taxes – – – – (134) 57 – – 16 (61) – (61)
Transfer to the
income statement – – – – (3) – – – – (3) – (3)
Dividends – – – (4,017) – – – – – (4,017) (162) (4,179)
Other – – – – – – – – – – 16 16
31 March 2009 4,153 153,348 (8,036) (83,820) 18,451 (259) 2,148 180 (3) 86,162 (1,385) 84,777
Issue or reissue of shares – – 189 (119) – – – – – 70 – 70
Share-based payment – 161(2) – – – – – – – 161 – 161
Acquisition of subsidiaries – – – (133) – – – – – (133) 1,636 1,503
Comprehensive income – – – 8,645 (1,365) (104) 209 860 67 8,312 233 8,545
Profit/(loss) – – – 8,645 – – – – – 8,645 (27) 8,618
OCI – before tax – – – – (1,320) (149) 377 860 79 (153) 260 107
OCI – taxes – – – – 39 45 (171) – (12) (99) – (99)
Transfer to the
income statement – – – – (84) – 3 – – (81) – (81)
Dividends – – – (4,131) – – – – – (4,131) (56) (4,187)
Other – – 37 (97) – – – – – (60) 1 (59)
31 March 2010 4,153 153,509 (7,810) (79,655) 17,086 (363) 2,357 1,040 64 90,381 429 90,810
Issue or reissue of shares – – 232 (125) – – – – – 107 – 107
Redemption or
cancellation of shares (71) 71 1,532 (1,532) – – – – – – – –
Purchase of own shares – – (2,125) – – – – – – (2,125) – (2,125)
Share-based payment – 180(2) – – – – – – – 180 – 180
Acquisition of subsidiaries – – – (120) – – – – – (120) 35 (85)
Comprehensive income – – – 7,968 (2,669) 136 (1,882) – 14 3,567 (186) 3,381
Profit/(loss) – – – 7,968 – – – – – 7,968 (98) 7,870
OCI – before tax – – – – (2,053) 190 347 – 14 (1,502) (88) (1,590)
OCI – taxes – – – – 14 (54) (37) – – (77) – (77)
Transfer to the
income statement – – – – (630) – (2,192)(3) – – (2,822) – (2,822)
Dividends – – – (4,468) – – – – – (4,468) (328) (4,796)
Other – – – 271 – – (238) – – 33 56 89
31 March 2011 4,082 153,760 (8,171) (77,661) 14,417 (227) 237 1,040 78 87,555 6 87,561
Notes:
(1) Includes share premium and the capital redemption reserve.
(2) Includes a £24 million tax credit (2010: £11 million credit, 2009: £9 million charge).
(3) Amount for 2011 includes a £208 million tax credit.
Consolidated statement of changes in equity