Vodafone 2011 Annual Report Download - page 36
Download and view the complete annual report
Please find page 36 of the 2011 Vodafone annual report below. You can navigate through the pages in the report by either clicking on the pages listed below, or by using the keyword search tool below to find specific information within the annual report.-
 1
1 -
2
-
3
-
4
-
5
-
6
-
7
-
8
-
9
-
10
-
11
-
12
-
13
-
14
-
15
-
16
-
17
-
18
-
19
-
20
-
21
-
22
-
23
-
24
-
25
-
 26
26 -
 27
27 -
 28
28 -
 29
29 -
 30
30 -
 31
31 -
 32
32 -
 33
33 -
 34
34 -
 35
35 -
 36
36 -
 37
37 -
 38
38 -
 39
39 -
 40
40 -
 41
41 -
 42
42 -
 43
43 -
 44
44 -
 45
45 -
 46
46 -
47
-
48
-
49
-
50
-
51
-
52
-
53
-
54
-
55
-
56
-
57
-
58
-
59
-
60
-
61
-
62
-
63
-
64
-
65
-
66
-
67
-
68
-
69
-
70
-
71
-
72
-
73
-
74
-
75
-
76
-
77
-
78
-
79
-
80
-
81
-
82
-
83
-
84
-
85
-
86
-
87
-
88
-
89
-
90
-
91
-
92
-
93
-
94
-
95
-
96
-
97
-
98
-
99
-
100
-
101
-
102
-
103
-
104
-
105
-
106
-
107
-
108
-
109
-
110
-
111
-
112
-
113
-
114
-
115
-
116
-
117
-
118
-
119
-
120
-
121
-
122
-
123
-
124
-
125
-
126
-
127
-
128
-
129
-
130
-
131
-
132
-
133
-
134
-
135
-
136
-
137
-
138
-
139
-
140
-
141
-
142
-
143
-
144
-
145
-
146
-
147
-
148
-
149
-
150
-
151
-
152
-
153
-
154
-
155
-
156
 |
 |

34 Vodafone Group Plc Annual Report 2011
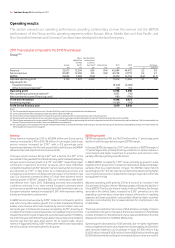
Operating results
This section presents our operating performance, providing commentary on how the revenue and the EBITDA
performance of the Group and its operating segments within Europe, Africa, Middle East and Asia Pacic, and
Non-Controlled Interests and Common Functions have developed in the last three years.
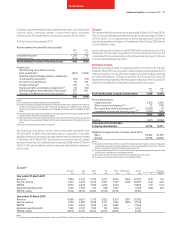
2011 nancial year compared to the 2010 nancial year
Group(1)(2)
Africa, Non-Controlled
Middle East Interests and
and Asia Common
Europe Pacific Functions(3) Eliminations 2011 2010 % change
£m £m £m £m £m £m £ Organic(4)
Revenue 32,015 13,304 659 (94) 45,884 44,472 3.2 2.8
Service revenue 30,097 12,292 412 (63) 42,738 41,719 2.4 2.1
EBITDA 10,823 3,999 (152) – 14,670 14,735 (0.4) (0.7)
Adjusted operating profit 5,726 1,272 4,820 – 11,818 11,466 3.1 1.8
Adjustments for:
Impairment losses (6,150) (2,100)
Other income and expense(5) (72) 114
Operating profit 5,596 9,480
Non-operating income and expense(6) 3,022 (10)
Net investment income/(financing costs) 880 (796)
Profit before taxation 9,498 8,674
Income tax expense (1,628) (56)
Profit for the financial year 7,870 8,618
Notes:
(1) The Group revised its segment structure on 1 October 2010. See note 3 to the consolidated financial statements.
(2) Current period results reflect average exchange rates of £1:€1.18 and £1:US$1.56.
(3) Common Functions primarily represent the results of the partner markets and the net result of unallocated central Group costs.
(4) Organic growth includes Vodacom at the current level of ownership but excludes Australia following the merger with Hutchison 3G Australia on 9 June 2009.
(5) Other income and expense for the year ended 31 March 2011 included £56 million representing the net loss on disposal of certain Alltel investments by Verizon Wireless. This is included within the
line item “Share of results in associates” in the consolidated income statement.
(6) Non-operating income and expense for the year ended 31 March 2011 includes £3,019 million profit arising on the sale of the Group’s 3.2% interest in China Mobile Limited. For further details see
“Other significant transactions” on page 49.
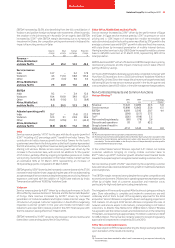
Revenue
Group revenue increased by 3.2% to £45,884 million and Group service
revenue increased by 2.4% to £42,738 million. On an organic basis Group
service revenue increased by 2.1%(*), with a 0.8 percentage point
improvement between the first and second half as both Europe and AMAP
delivered improved organic service revenue trends.
In Europe service revenue fell by 0.4%(*) with a decline of 0.3%(*) in the
second half of the year. Both the UK and Germany performed well delivering
full year service revenue growth of 4.7%(*) and 0.8%(*) respectively. Spain
continued to experience economic pressures which have intensified
competition leading to a 6.9%(*) decline in service revenue. Service revenue
also declined by 2.1%(*) in Italy driven by a challenging economic and
competitive environment combined with the impact of termination rate
cuts. Our improved commercial offers in Turkey have delivered service
revenue growth of 28.9%(*), despite a 52% cut in termination rates which
was effective from 1 April 2010. Challenging economic and competitive
conditions continued in our other central European businesses where
service revenue growth was also impacted by mobile termination rate cuts.
European enterprise revenue increased by 0.5%(*) with improved roaming
activity and important customer wins.
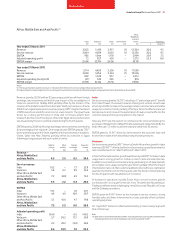
In AMAP service revenue grew by 9.5%(*). Vodacom continued to perform
well, with strong data revenue growth from mobile broadband offsetting
weaker voice revenue which was impacted by two termination rate cuts
during the year. In India service revenue increased by 16.2%(*), driven by an
increase in the mobile customer base and a more stable pricing environment
towards the end of the year. In Qatar the customer base reached 757,000 by
the end of the year, with 45% of the population now actively using Vodafone
services less than two years after launch. On an organic basis, service
revenue in Egypt declined by 0.8%(*) where performance was impacted by
the socio-political unrest during the fourth quarter.
EBITDA and profit
EBITDA decreased by 0.4% to £14,670 million with a 1.1 percentage point
decline in both the reported and organic EBITDA margin.
In Europe EBITDA decreased by 3.7%(*), with a decline in EBITDA margin of
1.7 percentage points, primarily driven by a reduction in service revenue in
most markets and higher investment in acquisition and retention costs,
partially offset by operating cost efficiencies.
In AMAP EBITDA increased by 7.5%(*), driven primarily by growth in India,
together with improvements in Vodacom, Ghana, New Zealand and Qatar,
partially offset by a slight decline in Egypt. The EBITDA margin fell 0.6
percentage points(*), the two main factors behind the decline being higher
recurring licence fee costs in India and the change in regional mix from the
strong growth in India.
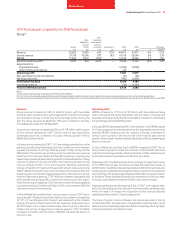
Adjusted operating profit grew by 3.1% as a result of an increase in the
Group’s share of results of Verizon Wireless partially offset by the decline in
Group EBITDA. The Group’s share of results in Verizon Wireless, the Group’s
associate in the United States, increased by 8.5%(*) primarily due to the
expanding customer base, robust data revenue, efficiencies in operating
expenses and lower acquisition costs partially offset by higher customer
retention costs reflecting the increased demand for smartphones in the
United States.
The Group recorded other net income of £5,342 million, primarily in relation
to a £2.8 billion net gain on the sale of the Group’s interests in China Mobile
Limited, £1.8 billion on the settlement of a tax case and £0.5 billion from the
disposal of investments in SoftBank Mobile Corp.
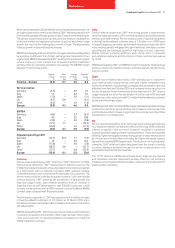
Operating profit decreased by 41.0% primarily due to higher impairment
losses compared to the prior year. Impairment losses totalling £6,150 million
were recorded relating to our businesses in Spain (£2,950 million), Italy
(£1,050 million), Ireland (£1,000 million), Greece (£800 million) and Portugal
(£350 million) primarily resulting from increased discount rates as a result of