Vodafone 2011 Annual Report Download - page 147
Download and view the complete annual report
Please find page 147 of the 2011 Vodafone annual report below. You can navigate through the pages in the report by either clicking on the pages listed below, or by using the keyword search tool below to find specific information within the annual report.-
 1
1 -
2
-
3
-
4
-
5
-
6
-
7
-
8
-
9
-
10
-
11
-
12
-
13
-
14
-
15
-
16
-
17
-
18
-
19
-
20
-
21
-
22
-
23
-
24
-
25
-
26
-
27
-
28
-
29
-
30
-
31
-
32
-
33
-
34
-
35
-
36
-
37
-
38
-
39
-
40
-
41
-
42
-
43
-
44
-
45
-
46
-
47
-
48
-
49
-
50
-
51
-
52
-
53
-
54
-
55
-
56
-
57
-
58
-
59
-
60
-
61
-
62
-
63
-
64
-
65
-
66
-
67
-
68
-
69
-
70
-
71
-
72
-
73
-
74
-
75
-
76
-
77
-
78
-
79
-
80
-
81
-
82
-
83
-
84
-
85
-
86
-
87
-
88
-
89
-
90
-
91
-
92
-
93
-
94
-
95
-
96
-
97
-
98
-
99
-
100
-
101
-
102
-
103
-
104
-
105
-
106
-
107
-
108
-
109
-
110
-
111
-
112
-
113
-
114
-
115
-
116
-
117
-
118
-
119
-
120
-
121
-
122
-
123
-
124
-
125
-
126
-
127
-
128
-
129
-
130
-
131
-
132
-
133
-
134
-
135
-
136
-
 137
137 -
 138
138 -
 139
139 -
 140
140 -
 141
141 -
 142
142 -
 143
143 -
 144
144 -
 145
145 -
 146
146 -
 147
147 -
 148
148 -
 149
149 -
 150
150 -
 151
151 -
 152
152 -
 153
153 -
 154
154 -
 155
155 -
 156
156
 |
 |

Vodafone Group Plc Annual Report 2011 145
Additional information
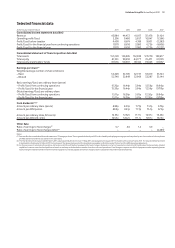
Organic M&A Foreign Reported
change activity exchange change
% pps pps %
31 March 2010
Group
Service revenue (1.6) 4.9 5.6 8.9
Data revenue 19.3 6.9 6.8 33.0
Fixed line revenue 7.9 6.0 6.7 20.6
Emerging markets service revenue 7.9 31.3 7.9 47.1
Europe
Service revenue (3.8) 0.1 4.6 0.9
Data revenue 17.7 – 5.5 23.2
Fixed line revenue 7.5 – 6.3 13.8
Enterprise revenue (4.8) – 4.5 (0.3)
Germany – service revenue for the quarter ended 31 March 2010 (1.6) – (2.4) (4.0)
Germany – mobile service revenue (5.0) – 6.0 1.0
Germany – mobile service revenue for the quarter ended 31 March 2010 (1.8) – (2.3) (4.1)
Germany – fixed line revenue 1.3 – 6.1 7.4
Spain – service revenue for the quarter ended 31 March 2010 (6.2) – (2.3) (8.5)
UK – service revenue for the quarter ended 31 March 2010 (2.6) – – (2.6)
Greece – service revenue (14.5) – 5.6 (8.9)
Netherlands – service revenue 3.0 – 6.4 9.4
Portugal – service revenue (4.9) – 6.1 1.2
Romania – service revenue (19.9) – 5.2 (14.7)
Romania – EBITDA (26.5) – 4.7 (21.8)
Turkey – service revenue for the quarter ended 31 March 2010 31.3 – 1.5 32.8
Africa, Middle East and Asia Pacific
India – service revenue for the quarter ended 31 March 2010 6.5 – 0.1 6.6
Indus Towers – contribution to India service revenue growth for the quarter ended 31 March 2010 0.3 – 0.1 0.4
Vodacom – data revenue 32.9 155.3 57.3 245.5
Egypt – service revenue 1.3 – 4.7 6.0
Egypt – data and fixed line revenue 64.2 – 4.4 68.6
Verizon Wireless
Revenue 5.0 11.8 5.5 22.3
Service revenue 6.3 11.7 5.6 23.6
EBITDA 4.4 10.9 5.4 20.7
Group’s share of result of Verizon Wireless 8.0 2.5 5.6 16.1
31 March 2009
Group
Service revenue (0.3) 3.1 13.1 15.9
Data revenue 25.9 0.7 17.1 43.7
Fixed line revenue 2.1 21.3 22.1 45.5
Emerging markets service revenue(3) 6.4 14.2 6.4 27.0
Europe
Germany – service revenue (2.5) (0.1) 17.6 15.0
Italy – service revenue 1.2 4.7 19.2 25.1
Spain – service revenue (4.9) 2.5 17.7 15.3
UK – service revenue (1.1) 0.3 – (0.8)
Africa, Middle East and Asia Pacific
India – pro-forma revenue 33 9 6 48
Vodacom – service revenue 13.8 2.1 (5.2) 10.7
Notes:
(1) Data revenue in South Africa grew by 41.8%(*). Excluding the impact of reclassifications between messaging and data revenue during the year, data revenue grew by 35.9%(*).
(2) Organic growth rates include the impact of a non-cash revenue adjustment which was recorded to properly defer previously recognised data revenue that will be earned and recognised in future periods.
Excluding this the equivalent growth rates for service revenue, revenue, adjusted EBITDA and the Group’s share of result in Verizon Wireless would have been 6.4%(*), 6.6%(*), 8.2%(*) and 10.8%(*) respectively.
(3) Excludes India, Ghana and Qatar as these were not owned for the full financial year.