Vodafone 2011 Annual Report Download - page 116
Download and view the complete annual report
Please find page 116 of the 2011 Vodafone annual report below. You can navigate through the pages in the report by either clicking on the pages listed below, or by using the keyword search tool below to find specific information within the annual report.-
 1
1 -
2
-
3
-
4
-
5
-
6
-
7
-
8
-
9
-
10
-
11
-
12
-
13
-
14
-
15
-
16
-
17
-
18
-
19
-
20
-
21
-
22
-
23
-
24
-
25
-
26
-
27
-
28
-
29
-
30
-
31
-
32
-
33
-
34
-
35
-
36
-
37
-
38
-
39
-
40
-
41
-
42
-
43
-
44
-
45
-
46
-
47
-
48
-
49
-
50
-
51
-
52
-
53
-
54
-
55
-
56
-
57
-
58
-
59
-
60
-
61
-
62
-
63
-
64
-
65
-
66
-
67
-
68
-
69
-
70
-
71
-
72
-
73
-
74
-
75
-
76
-
77
-
78
-
79
-
80
-
81
-
82
-
83
-
84
-
85
-
86
-
87
-
88
-
89
-
90
-
91
-
92
-
93
-
94
-
95
-
96
-
97
-
98
-
99
-
100
-
101
-
102
-
103
-
104
-
105
-
 106
106 -
 107
107 -
 108
108 -
 109
109 -
 110
110 -
 111
111 -
 112
112 -
 113
113 -
 114
114 -
 115
115 -
 116
116 -
 117
117 -
 118
118 -
 119
119 -
 120
120 -
 121
121 -
 122
122 -
 123
123 -
 124
124 -
 125
125 -
 126
126 -
127
-
128
-
129
-
130
-
131
-
132
-
133
-
134
-
135
-
136
-
137
-
138
-
139
-
140
-
141
-
142
-
143
-
144
-
145
-
146
-
147
-
148
-
149
-
150
-
151
-
152
-
153
-
154
-
155
-
156
 |
 |

114 Vodafone Group Plc Annual Report 2011
Notes to the consolidated nancial statements continued
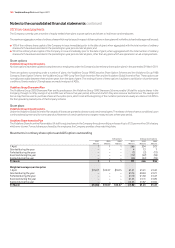
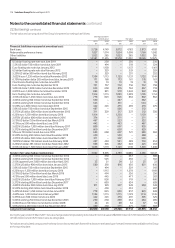
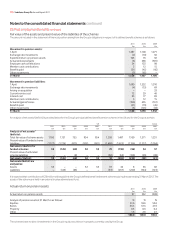
22. Borrowings continued
The fair value and carrying value of the Group’s long-term borrowings is as follows:
Sterling equivalent
nominal value Fair value Carrying value
2011 2010 2011 2010 2011 2010
£m £m £m £m £m £m
Financial liabilities measured at amortised cost:
Bank loans 5,728 4,149 5,872 4,183 5,873 4,183
Redeemable preference shares 1,027 1,174 1,054 1,098 1,169 1,242
Other liabilities 1,022 385 1,023 385 1,022 385
Bonds: 14,581 11,455 15,578 11,961 16,046 12,675
US dollar floating rate note due June 2011 – 230 – 230 – 230
5.5% US dollar 750 million bond due June 2011 – 494 – 518 – 524
Euro floating rate note due January 2012 – 1,158 – 1,157 – 1,161
US dollar floating rate note due February 2012 – 329 – 329 – 329
5.35% US dollar 500 million bond due February 2012 – 329 – 351 – 352
3.625% euro 1,250 million bond due November 2012 1,104 1,113 1,125 1,157 1,132 1,149
6.75% Australian dollar 265 million bond due January 2013 171 160 173 161 176 167
Czech krona floating rate note due June 2013 19 19 19 19 19 19
Euro floating rate note due September 2013 751 757 752 756 752 758
5.0% US dollar 1,000 million bond due December 2013 623 658 676 704 667 718
6.875% euro 1,000 million bond due December 2013 883 891 970 1,024 922 936
Euro floating rate note due June 2014 1,104 1,113 1,099 1,099 1,105 1,114
4.15% US dollar 1,250 million bond due June 2014 778 823 826 856 802 852
4.625% sterling 350 million bond due September 2014 350 – 367 – 382 –
4.625% sterling 525 million bond due September 2014 525 – 551 – 544 –
5.125% euro 500 million bond due April 2015 442 445 475 496 470 475
5.0% US dollar 750 million bond due September 2015 467 – 506 – 512 –
3.375% US dollar 500 million bond due November 2015 311 329 317 327 312 330
6.25% euro 1,250 million bond due January 2016 1,104 – 1,230 – 1,139 –
2.875% US dollar 600 million bond due March 2016 374 – 371 – 371 –
5.75% US dollar 750 million bond due March 2016 467 – 523 – 532 –
4.75% euro 500 million bond due June 2016 442 – 463 – 487 –
5.625% US dollar 1,300 million bond due February 2017 809 – 897 – 920 –
5.375% sterling 600 million bond due December 2017 600 – 638 – 629 –
5% euro 750 million bond due June 2018 663 668 697 721 689 694
8.125% sterling 450 million bond due November 2018 450 – 550 – 488 –
4.375% US dollar 500 million bond due March 2021 311 – 307 – 309 –
7.875% US dollar 750 million bond due February 2030 467 494 591 589 759 814
6.25% US dollar 495 million bond due November 2032 308 326 332 328 425 453
6.15% US dollar 1,700 million bond due February 2037 1,058 1,119 1,123 1,139 1,503 1,600
Bonds in fair value hedge relationships: 3,962 9,395 4,199 10,085 4,265 10,147
4.625% sterling 350 million bond due September 2014 – 350 – 367 – 388
4.625% sterling 525 million bond due September 2014 – 525 – 550 – 532
2.15% Japanese yen 3,000 million bond due April 2015 23 21 24 22 23 22
5.375% US dollar 900 million bond due January 2015 560 592 616 636 621 650
5.0% US dollar 750 million bond due September 2015 – 494 – 529 – 543
6.25% euro 1,250 million bond due January 2016 – 1,113 – 1,278 – 1,168
5.75% US dollar 750 million bond due March 2016 – 494 – 536 – 556
4.75% euro 500 million bond due June 2016 – 445 – 477 – 503
5.625% US dollar 1,300 million bond due February 2017 – 856 – 919 – 960
5.375% sterling 600 million bond due December 2017 – 600 – 634 – 628
4.625% US dollar 500 million bond due July 2018 311 329 327 328 338 349
8.125% sterling 450 million bond due November 2018 – 450 – 553 – 487
5.45% US dollar 1,250 million bond due June 2019 778 823 850 857 823 849
4.65% euro 1,250 million bond January 2022 1,104 1,113 1,115 1,129 1,114 1,145
5.375% euro 500 million bond June 2022 442 445 470 481 505 525
5.625% sterling 250 million bond due December 2025 250 250 258 254 284 285
6.6324% euro 50 million bond due December 2028 44 45 68 64 57 54
5.9% sterling 450 million bond due November 2032 450 450 471 471 500 503
Long-term borrowings 26,320 26,558 27,726 27,712 28,375 28,632
During the year ended 31 March 2011 fair value hedge relationships relating to bonds with nominal value US$2,800 million (£1,743 million), €1,750 million
(£1,546 million) and £1,925 million were de-designated.
Fair values are calculated using quoted market prices or discounted cash flows with a discount rate based upon forward interest rates available to the Group
at the reporting date.