Vodafone 2011 Annual Report Download - page 117
Download and view the complete annual report
Please find page 117 of the 2011 Vodafone annual report below. You can navigate through the pages in the report by either clicking on the pages listed below, or by using the keyword search tool below to find specific information within the annual report.-
 1
1 -
2
-
3
-
4
-
5
-
6
-
7
-
8
-
9
-
10
-
11
-
12
-
13
-
14
-
15
-
16
-
17
-
18
-
19
-
20
-
21
-
22
-
23
-
24
-
25
-
26
-
27
-
28
-
29
-
30
-
31
-
32
-
33
-
34
-
35
-
36
-
37
-
38
-
39
-
40
-
41
-
42
-
43
-
44
-
45
-
46
-
47
-
48
-
49
-
50
-
51
-
52
-
53
-
54
-
55
-
56
-
57
-
58
-
59
-
60
-
61
-
62
-
63
-
64
-
65
-
66
-
67
-
68
-
69
-
70
-
71
-
72
-
73
-
74
-
75
-
76
-
77
-
78
-
79
-
80
-
81
-
82
-
83
-
84
-
85
-
86
-
87
-
88
-
89
-
90
-
91
-
92
-
93
-
94
-
95
-
96
-
97
-
98
-
99
-
100
-
101
-
102
-
103
-
104
-
105
-
106
-
 107
107 -
 108
108 -
 109
109 -
 110
110 -
 111
111 -
 112
112 -
 113
113 -
 114
114 -
 115
115 -
 116
116 -
 117
117 -
 118
118 -
 119
119 -
 120
120 -
 121
121 -
 122
122 -
 123
123 -
 124
124 -
 125
125 -
 126
126 -
 127
127 -
128
-
129
-
130
-
131
-
132
-
133
-
134
-
135
-
136
-
137
-
138
-
139
-
140
-
141
-
142
-
143
-
144
-
145
-
146
-
147
-
148
-
149
-
150
-
151
-
152
-
153
-
154
-
155
-
156
 |
 |

Vodafone Group Plc Annual Report 2011 115
Financials
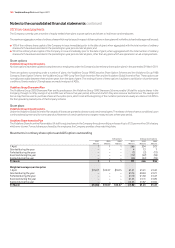
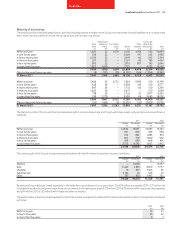
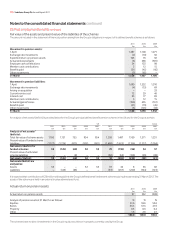
Maturity of borrowings
The maturity profile of the anticipated future cash flows including interest in relation to the Group’s non-derivative financial liabilities on an undiscounted
basis, which, therefore, differs from both the carrying value and fair value, is as follows:
Redeemable Loans in fair
Bank preference Commercial Other value hedge
loans shares paper Bonds liabilities relationships Total
£m £m £m £m £m £m £m
Within one year 1,881 52 1,670 3,292 3,766 203 10,864
In one to two years 528 52 – 2,009 191 203 2,983
In two to three years 2,510 52 – 2,919 60 203 5,744
In three to four years 321 52 – 3,251 60 763 4,447
In four to five years 885 52 – 3,613 901 195 5,646
In more than five years 1,825 1,240 – 7,725 – 4,752 15,542
7,950 1,500 1,670 22,809 4,978 6,319 45,226
Effect of discount/financing rates (8) (331) (10) (4,293) (249) (2,054) (6,945)
31 March 2011 7,942 1,169 1,660 18,516 4,729 4,265 38,281
Within one year 3,406 93 2,572 1,634 3,983 510 12,198
In one to two years 858 56 – 3,008 145 510 4,577
In two to three years 847 56 – 1,712 156 510 3,281
In three to four years 1,852 56 – 2,671 – 510 5,089
In four to five years 138 56 – 2,152 31 1,977 4,354
In more than five years 598 1,370 – 6,009 68 9,983 18,028
7,699 1,687 2,572 17,186 4,383 14,000 47,527
Effect of discount/financing rates (56) (445) (9) (3,337) (32) (3,853) (7,732)
31 March 2010 7,643 1,242 2,563 13,849 4,351 10,147 39,795
The maturity profile of the Group’s financial derivatives (which include interest rate and foreign exchange swaps), using undiscounted cash flows, is
as follows:
2011 2010
Payable Receivable Payable Receivable
£m £m £m £m
Within one year 14,840 15,051 13,067 13,154
In one to two years 631 829 929 938
In two to three years 724 882 1,083 974
In three to four years 667 770 1,040 932
In four to five years 619 690 868 816
In more than five years 3,715 4,592 7,607 5,912
21,196 22,814 24,594 22,726
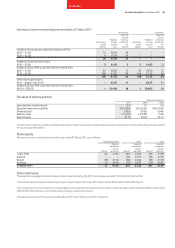
The currency split of the Group’s foreign exchange derivatives, all of which mature in less than one year, is as follows:
2011 2010
Payable Receivable Payable Receivable
£m £m £m £m
Sterling – 10,198 – 8,257
Euro 11,422 2,832 8,650 3,177
US dollar 13 387 1,545 55
Japanese yen 2,164 23 548 21
Other 727 832 1,485 755
14,326 14,272 12,228 12,265
Payables and receivables are stated separately in the table above as settlement is on a gross basis. The £54 million net payable (2010: £37 million net
receivable) in relation to foreign exchange financial instruments in the table above is split £153 million (2010: £95 million) within trade and other payables
and £99 million (2010: £132 million) within trade and other receivables.
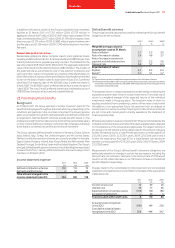
The present value of minimum lease payments under finance lease arrangements under which the Group has leased certain of its equipment is analysed
as follows:
2011 2010
£m £m
Within one year 14 21
In two to five years 45 47
In more than five years 6 7