Vodafone 2011 Annual Report Download - page 126
Download and view the complete annual report
Please find page 126 of the 2011 Vodafone annual report below. You can navigate through the pages in the report by either clicking on the pages listed below, or by using the keyword search tool below to find specific information within the annual report.-
 1
1 -
2
-
3
-
4
-
5
-
6
-
7
-
8
-
9
-
10
-
11
-
12
-
13
-
14
-
15
-
16
-
17
-
18
-
19
-
20
-
21
-
22
-
23
-
24
-
25
-
26
-
27
-
28
-
29
-
30
-
31
-
32
-
33
-
34
-
35
-
36
-
37
-
38
-
39
-
40
-
41
-
42
-
43
-
44
-
45
-
46
-
47
-
48
-
49
-
50
-
51
-
52
-
53
-
54
-
55
-
56
-
57
-
58
-
59
-
60
-
61
-
62
-
63
-
64
-
65
-
66
-
67
-
68
-
69
-
70
-
71
-
72
-
73
-
74
-
75
-
76
-
77
-
78
-
79
-
80
-
81
-
82
-
83
-
84
-
85
-
86
-
87
-
88
-
89
-
90
-
91
-
92
-
93
-
94
-
95
-
96
-
97
-
98
-
99
-
100
-
101
-
102
-
103
-
104
-
105
-
106
-
107
-
108
-
109
-
110
-
111
-
112
-
113
-
114
-
115
-
 116
116 -
 117
117 -
 118
118 -
 119
119 -
 120
120 -
 121
121 -
 122
122 -
 123
123 -
 124
124 -
 125
125 -
 126
126 -
 127
127 -
 128
128 -
 129
129 -
 130
130 -
 131
131 -
 132
132 -
 133
133 -
 134
134 -
 135
135 -
 136
136 -
137
-
138
-
139
-
140
-
141
-
142
-
143
-
144
-
145
-
146
-
147
-
148
-
149
-
150
-
151
-
152
-
153
-
154
-
155
-
156
 |
 |

124 Vodafone Group Plc Annual Report 2011
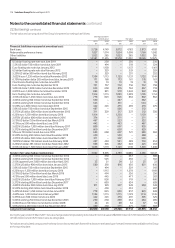
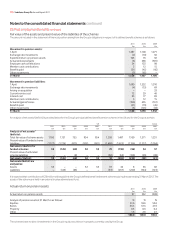
Notes to the consolidated nancial statements continued
30. Related party transactions continued
Transactions with directors other than compensation
During the three years ended 31 March 2011, and as of 16 May 2011, neither any director nor any other executive officer, nor any associate of any director
or any other executive officer, was indebted to the Company.
During the three years ended 31 March 2011, and as of 16 May 2011, the Company has not been a party to any other material transaction, or proposed
transactions, in which any member of the key management personnel (including directors, any other executive officer, senior manager, any spouse or
relative of any of the foregoing or any relative of such spouse) had or was to have a direct or indirect material interest.
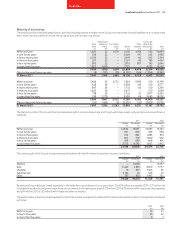
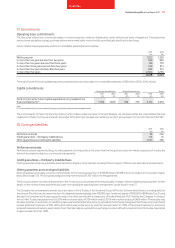
31. Employees
The average employee headcount during the year by nature of activity and by segment is shown below. During the year the Group changed its organisation
structure. The information on employees by segment are presented on the revised basis, with prior years amended to conform to the current year presentation.
2011 2010 2009
Employees Employees Employees
By activity:
Operations 14,171 14,099 13,889
Selling and distribution 28,311 27,398 25,174
Customer care and administration 41,380 43,493 40,034
83,862 84,990 79,097
By segment:
Germany 12,594 13,507 13,788
Italy 6,121 6,207 6,247
Spain 4,389 4,326 4,354
UK 8,174 9,766 10,350
Other Europe 18,953 18,582 19,015
Europe 50,231 52,388 53,754
India 10,743 10,132 8,674
Vodacom 7,320 6,833 3,246
Other Africa, Middle East and Asia Pacific 10,896 10,887 9,525
Africa, Middle East and Asia Pacific 28,959 27,852 21,445
Non-Controlled Interests and Common Functions 4,672 4,750 3,898
Total 83,862 84,990 79,097
The cost incurred in respect of these employees (including directors) was:
2011 2010 2009
£m £m £m
Wages and salaries 2,960 3,045 2,607
Social security costs 392 415 379
Share-based payments (note 20) 156 150 128
Other pension costs (note 23) 134 160 113
3,642 3,770 3,227
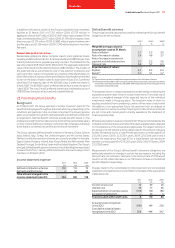
32. Subsequent events
SFR
On 3 April 2011 the Group announced an agreement to sell its entire 44% shareholding in SFR to Vivendi for cash consideration of €7.75 billion (£6.8 billion).
The Group will also receive a final dividend from SFR of €200 million (£176 million) on completion of the transaction.
Subject to customary competition authority and regulatory approvals, the transaction is expected to complete during the second calendar quarter of 2011.
At 31 March 2011 the SFR investment had a carrying value of £4.2 billion and was reported within the Non-Controlled Investments and Common
Functions segment.