Vodafone 2011 Annual Report Download - page 49
Download and view the complete annual report
Please find page 49 of the 2011 Vodafone annual report below. You can navigate through the pages in the report by either clicking on the pages listed below, or by using the keyword search tool below to find specific information within the annual report.-
 1
1 -
2
-
3
-
4
-
5
-
6
-
7
-
8
-
9
-
10
-
11
-
12
-
13
-
14
-
15
-
16
-
17
-
18
-
19
-
20
-
21
-
22
-
23
-
24
-
25
-
26
-
27
-
28
-
29
-
30
-
31
-
32
-
33
-
34
-
35
-
36
-
37
-
38
-
 39
39 -
 40
40 -
 41
41 -
 42
42 -
 43
43 -
 44
44 -
 45
45 -
 46
46 -
 47
47 -
 48
48 -
 49
49 -
 50
50 -
 51
51 -
 52
52 -
 53
53 -
 54
54 -
 55
55 -
 56
56 -
 57
57 -
 58
58 -
 59
59 -
60
-
61
-
62
-
63
-
64
-
65
-
66
-
67
-
68
-
69
-
70
-
71
-
72
-
73
-
74
-
75
-
76
-
77
-
78
-
79
-
80
-
81
-
82
-
83
-
84
-
85
-
86
-
87
-
88
-
89
-
90
-
91
-
92
-
93
-
94
-
95
-
96
-
97
-
98
-
99
-
100
-
101
-
102
-
103
-
104
-
105
-
106
-
107
-
108
-
109
-
110
-
111
-
112
-
113
-
114
-
115
-
116
-
117
-
118
-
119
-
120
-
121
-
122
-
123
-
124
-
125
-
126
-
127
-
128
-
129
-
130
-
131
-
132
-
133
-
134
-
135
-
136
-
137
-
138
-
139
-
140
-
141
-
142
-
143
-
144
-
145
-
146
-
147
-
148
-
149
-
150
-
151
-
152
-
153
-
154
-
155
-
156
 |
 |

Vodafone Group Plc Annual Report 2011 47
Performance
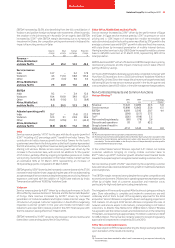
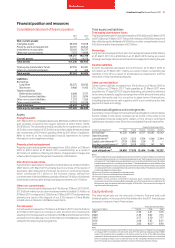
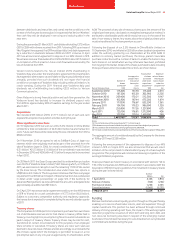
Consolidated statement of nancial position
2011 2010
£m £m
Non-current assets
Intangible assets 68,558 74,258
Property, plant and equipment 20,181 20,642
Investments in associates 38,105 36,377
Other non-current assets 7,373 11,489
134,217 142,766
Current assets 17,003 14,219
Total assets 151,220 156,985
Total equity shareholders’ funds 87,555 90,381
Total non-controlling interests 6 429
Total equity 87,561 90,810
Liabilities
Borrowings
Long-term 28,375 28,632
Short-term 9,906 11,163
Taxation liabilities
Deferred tax liabilities 6,486 7,377
Current taxation liabilities 2,262 2,874
Other non-current liabilities 1,373 1,550
Other current liabilities 15,257 14,579
Total liabilities 63,659 66,175
Total equity and liabilities 151,220 156,985
Assets
Intangible assets
At 31 March 2011 our intangible assets were £68.6 billion (2010: £74.3 billion)
with goodwill comprising the largest element at £45.2 billion (2010:
£51.8 billion). The decrease primarily resulted from impairment losses of
£6.2 billion, amortisation of £3.5 billion and unfavourable foreign exchange
rate movements of £0.9 billion partially offset by £4.7 billion of additions.
Refer to note 10 to the consolidated financial statements for further
information on the impairment charge.
Property, plant and equipment
Property, plant and equipment decreased from £20.6 billion at 31 March
2010 to £20.2 billion at 31 March 2011 predominantly as a result of
£4.7 billion of additions offset by £4.4 billion of depreciation charges and
unfavourable foreign exchange rate movements of £0.6 billion.
Investments in associates
Investments in associates increased from £36.4 billion at 31 March 2010 to
£38.1 billion at 31 March 2011 primarily due to our share of the results of
associates, after deductions of interest, tax and non-controlling interest,
which contributed £5.1 billion to the increase, mainly arising from
our investment in Verizon Wireless, partially offset by £1.4 billion of dividends
received and unfavourable foreign exchange movements of £1.9 billion.
Other non-current assets
Other non-current assets decreased to £7.4 billion at 31 March 2011 (2010:
£11.5 billion) mainly due to other investments which totalled £1.4 billion at
31 March 2011 compared to £7.6 billion at 31 March 2010. The decrease was
primarily as a result of the disposal of our 3.2% interest in China Mobile
Limited and our interests in SoftBank investments.
Current assets
Current assets increased to £17.0 billion at 31 March 2011 from £14.2 billion
at 31 March 2010 due to an increase in cash and short-term investments
resulting from the disposal of our interests in SoftBank and the element of the
proceeds from the disposal of our 3.2% interest in China Mobile Limited not
utilised for the share buyback programme.
Total equity and liabilities
Total equity shareholders’ funds
Total equity shareholders’ funds decreased from £90.4 billion at 31 March 2010
to £87.6 billion at 31 March 2011. The profit for the year of £8.0 billion was more
than offset by equity dividends of £4.5 billion, an other comprehensive loss of
£4.5 billion and the share buyback of £2.1 billion.
Borrowings
Long-term borrowings and short-term borrowings decreased to £38.3 billion
at 31 March 2011 from £39.8 billion at 31 March 2010 mainly as a result
of foreign exchange rate movements and bond repayments during the year.
Taxation liabilities
Current tax liabilities decreased from £2.9 billion at 31 March 2010 to
£2.3 billion at 31 March 2011 mainly as a result of lower outstanding tax
liabilities in the US as a result of accelerated tax depreciation and the
resolution of long-standing tax disputes.
Other current liabilities
Other current liabilities increased from £14.6 billion at 31 March 2010 to
£15.3 billion at 31 March 2011. Trade payables at 31 March 2011 were
equivalent to 37 days (2010: 31 days) outstanding, calculated by reference
to the amount owed to suppliers as a proportion of the amounts invoiced by
suppliers during the year. It is our policy to agree terms of transactions,
including payment terms, with suppliers and it is our normal practice that
payment is made accordingly.
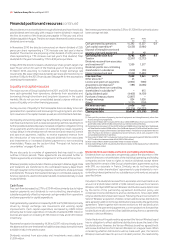
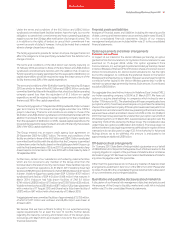
Contractual obligations and contingencies
A summary of our principal contractual financial obligations is shown below.
Further details on the items included can be found in the notes to the
consolidated financial statements. Details of the Group’s contingent
liabilities are included in note 28 to the consolidated financial statements.
Payments due by period £m
Contractual obligations(1) Total <1 year 1-3 years 3-5 years >5 years
Borrowings(2) 45,226 10,864 8,727 10,093 15,542
Operating lease
commitments(3) 6,513 1,225 1,704 1,240 2,344
Capital commitments(3)(4) 2,124 1,885 228 11 –
Purchase commitments(5) 5,937 3,619 1,835 142 341
Total contractual
cash obligations(1)
59,800 17,593
12,494 11,486
18,227
Notes:
(1) The above table of contractual obligations includes commitments in respect of options over interests
in Group businesses held by non-controlling shareholders (see “Option agreements and similar
arrangements”) and obligations to pay dividends to non-controlling shareholders (see “Dividends
from associates and to non-controlling shareholders”). The table excludes current and deferred tax
liabilities and obligations under post employment benefit schemes, details of which are provided
in notes 6 and 23 to the consolidated financial statements respectively. The table also excludes the
contractual obligations of associates.
(2) See note 22 to the consolidated financial statements.
(3) See note 27 to the consolidated financial statements.
(4) Primarily related to network infrastructure.
(5) In addition to the purchase commitments disclosed above, Vodafone Netherlands has
announced its intention to acquire BelCompany BV, one of the largest telecom retailers in the
Netherlands, from the Macintosh Retail Group for €120 million. The transaction is subject to
regulatory and other approvals.
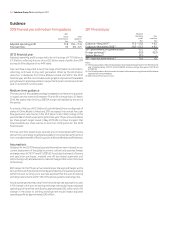
Equity dividends
The table below sets out the amounts of interim, final and total cash
dividends paid or, in the case of the final dividend for the 2011 financial year,
proposed, in respect of each financial year.
Pence per ordinary share
Year ended 31 March Interim Final Total
2007 2.35 4.41 6.76
2008 2.49 5.02 7.51
2009 2.57 5.20 7.77
2010 2.66 5.65 8.31
2011 2.85 6.05(1) 8.90
Note:
(1) The final dividend for the year ended 31 March 2011 was proposed on 17 May 2011 and is payable
on 5 August 2011 to holders on record as of 3 June 2011. For american depositary share (‘ADS’)
holders the dividend will be payable in US dollars under the terms of the ADS depositary
agreement. Dividend payments on ordinary shares will be paid by direct credit into a nominated
bank or building society account or, alternatively, into the Company’s dividend reinvestment
plan. The Company no longer pays dividends in respect of ordinary shares by cheque.
Financial position and resources