Vodafone 2011 Annual Report Download - page 121
Download and view the complete annual report
Please find page 121 of the 2011 Vodafone annual report below. You can navigate through the pages in the report by either clicking on the pages listed below, or by using the keyword search tool below to find specific information within the annual report.-
 1
1 -
2
-
3
-
4
-
5
-
6
-
7
-
8
-
9
-
10
-
11
-
12
-
13
-
14
-
15
-
16
-
17
-
18
-
19
-
20
-
21
-
22
-
23
-
24
-
25
-
26
-
27
-
28
-
29
-
30
-
31
-
32
-
33
-
34
-
35
-
36
-
37
-
38
-
39
-
40
-
41
-
42
-
43
-
44
-
45
-
46
-
47
-
48
-
49
-
50
-
51
-
52
-
53
-
54
-
55
-
56
-
57
-
58
-
59
-
60
-
61
-
62
-
63
-
64
-
65
-
66
-
67
-
68
-
69
-
70
-
71
-
72
-
73
-
74
-
75
-
76
-
77
-
78
-
79
-
80
-
81
-
82
-
83
-
84
-
85
-
86
-
87
-
88
-
89
-
90
-
91
-
92
-
93
-
94
-
95
-
96
-
97
-
98
-
99
-
100
-
101
-
102
-
103
-
104
-
105
-
106
-
107
-
108
-
109
-
110
-
 111
111 -
 112
112 -
 113
113 -
 114
114 -
 115
115 -
 116
116 -
 117
117 -
 118
118 -
 119
119 -
 120
120 -
 121
121 -
 122
122 -
 123
123 -
 124
124 -
 125
125 -
 126
126 -
 127
127 -
 128
128 -
 129
129 -
 130
130 -
 131
131 -
132
-
133
-
134
-
135
-
136
-
137
-
138
-
139
-
140
-
141
-
142
-
143
-
144
-
145
-
146
-
147
-
148
-
149
-
150
-
151
-
152
-
153
-
154
-
155
-
156
 |
 |
Vodafone Group Plc Annual Report 2011 119
Financials
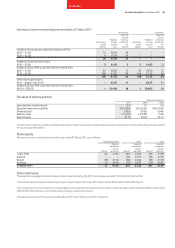
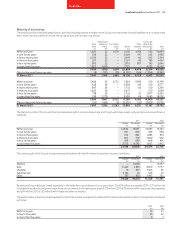
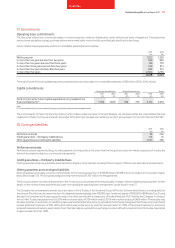
History of experience adjustments
2011 2010 2009 2008 2007
£m £m £m £m £m
Experience adjustments on pension liabilities:
Amount 23 8 6 (5) (2)
Percentage of pension liabilities 1% – – – –
Experience adjustments on pension assets:
Amount (6) 286 (381) (176) 26
Percentage of pension assets – 19% (35%) (14%) 2%
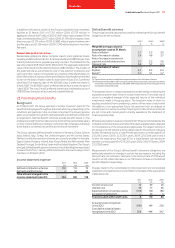
24. Provisions
Asset
retirement Other
obligations provisions Total
£m £m £m
1 April 2009 361 545 906
Exchange movements (7) (6) (13)
Arising on acquisition – 20 20
Amounts capitalised in the year 40 – 40
Amounts charged to the income statement – 259 259
Utilised in the year − payments (3) (157) (160)
Amounts released to the income statement – (37) (37)
Other (21) – (21)
31 March 2010 370 624 994
Exchange movements (4) (12) (16)
Amounts capitalised in the year 4 – 4
Amounts charged to the income statement – 300 300
Utilised in the year − payments (8) (193) (201)
Amounts released to the income statement – (59) (59)
Other (47) 66 19
31 March 2011 315 726 1,041
Provisions have been analysed between current and non-current as follows:
2011 2010
£m £m
Current liabilities 559 497
Non-current liabilities 482 497
1,041 994
Asset retirement obligations
In the course of the Group’s activities, a number of sites and other assets are utilised which are expected to have costs associated with exiting and ceasing
their use. The associated cash outflows are generally expected to occur at the dates of exit of the assets to which they relate, which are long-term in nature.
Other provisions
Included within other provisions are provisions for legal and regulatory disputes and amounts provided for property and restructuring costs. The Group is
involved in a number of legal and other disputes, including notification of possible claims. The directors of the Company, after taking legal advice, have
established provisions after taking into account the facts of each case. The timing of cash outflows associated with legal claims cannot be reasonably
determined. For a discussion of certain legal issues potentially affecting the Group, refer to note 28. The associated cash outflows for restructuring costs
are substantially short-term in nature. The timing of the cash flows associated with property is dependent upon the remaining term of the associated lease.