Vodafone 2011 Annual Report Download - page 119
Download and view the complete annual report
Please find page 119 of the 2011 Vodafone annual report below. You can navigate through the pages in the report by either clicking on the pages listed below, or by using the keyword search tool below to find specific information within the annual report.-
 1
1 -
2
-
3
-
4
-
5
-
6
-
7
-
8
-
9
-
10
-
11
-
12
-
13
-
14
-
15
-
16
-
17
-
18
-
19
-
20
-
21
-
22
-
23
-
24
-
25
-
26
-
27
-
28
-
29
-
30
-
31
-
32
-
33
-
34
-
35
-
36
-
37
-
38
-
39
-
40
-
41
-
42
-
43
-
44
-
45
-
46
-
47
-
48
-
49
-
50
-
51
-
52
-
53
-
54
-
55
-
56
-
57
-
58
-
59
-
60
-
61
-
62
-
63
-
64
-
65
-
66
-
67
-
68
-
69
-
70
-
71
-
72
-
73
-
74
-
75
-
76
-
77
-
78
-
79
-
80
-
81
-
82
-
83
-
84
-
85
-
86
-
87
-
88
-
89
-
90
-
91
-
92
-
93
-
94
-
95
-
96
-
97
-
98
-
99
-
100
-
101
-
102
-
103
-
104
-
105
-
106
-
107
-
108
-
 109
109 -
 110
110 -
 111
111 -
 112
112 -
 113
113 -
 114
114 -
 115
115 -
 116
116 -
 117
117 -
 118
118 -
 119
119 -
 120
120 -
 121
121 -
 122
122 -
 123
123 -
 124
124 -
 125
125 -
 126
126 -
 127
127 -
 128
128 -
 129
129 -
130
-
131
-
132
-
133
-
134
-
135
-
136
-
137
-
138
-
139
-
140
-
141
-
142
-
143
-
144
-
145
-
146
-
147
-
148
-
149
-
150
-
151
-
152
-
153
-
154
-
155
-
156
 |
 |

Vodafone Group Plc Annual Report 2011 117
Financials
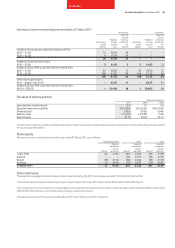
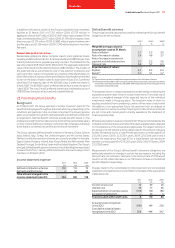
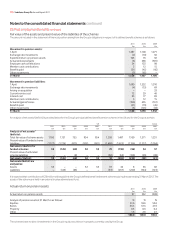
Dened benet schemes
The principal actuarial assumptions used for estimating the Group’s benefit
obligations are set out below:
2011(1) 2010(1) 2009(1)
% % %
Weighted average actuarial
assumptions used at 31 March:
Rate of inflation 3.1 3.5 2.6
Rate of increase in salaries 2.9 4.6 3.7
Rate of increase in pensions in
payment and deferred pensions 3.1 3.5 2.6
Discount rate 5.6 5.7 6.3
Expected rates of return:
Equities 8.2 8.5 8.4
Bonds(2) 5.1 5.1 5.7
Notes:
(1) Figures shown represent a weighted average assumption of the individual schemes.
(2) For the year ended 31 March 2011 the expected rate of return for bonds consisted of a 5.3% rate
of return for corporate bonds (2010: 5.5%; 2009: 6.1%) and a 3.6% rate of return for government
bonds (2010: 4.0%; 2009: 4.0%).
The expected return on assets assumptions are derived by considering the
expected long-term rates of return on plan investments. The overall rate of
return is a weighted average of the expected returns of the individual
investments made in the group plans. The long-term rates of return on
equities are derived from considering current risk free rates of return with
the addition of an appropriate future risk premium from an analysis of
historic returns in various countries. The long-term rates of return on bonds
are set in line with market yields currently available at the statement of
financial position date.
Mortality assumptions used are consistent with those recommended by the
individual scheme actuaries and reflect the latest available tables, adjusted
for the experience of the Group where appropriate. The largest scheme in
the Group is the UK scheme and the tables used for this scheme indicate a
further life expectancy for a male/female pensioner currently aged 65 of
23.5/24.3 years (2010: 22.3/25.4 years, 2009: 22.0/24.8 years) and a
further life expectancy from age 65 for a male/female non-pensioner
member currently aged 40 of 27.0/26.6 years (2010: 24.6/27.9 years, 2009:
23.2/26.0 years).
Measurement of the Group’s defined benefit retirement obligations are
particularly sensitive to changes in certain key assumptions including the
discount rate. An increase or decrease in the discount rate of 0.5% would
result in a £156 million decrease or a £178 million increase in the defined
benefit obligation respectively.
Charges made to the consolidated income statement and consolidated
statement of comprehensive income (‘SOCI’) on the basis of the assumptions
stated above are:
2011 2010 2009
£m £m £m
Current service cost 12 29 46
Interest cost 95 77 83
Expected return on pension assets (103) (76) (92)
Curtailment/settlement – 20 3
Total included within staff costs 4 50 40
Actuarial losses recognised
in the SOCI (190) 149 220
Cumulative actuarial losses
recognised in the SOCI 306 496 347
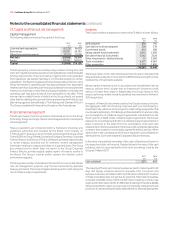
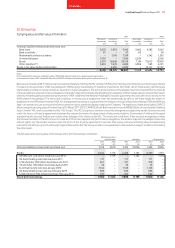
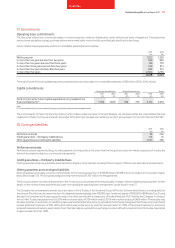
In addition to the above, certain of the Group’s subsidiaries had committed
facilities at 31 March 2011 of £7,152 million (2010: £5,759 million) in
aggregate, of which £667 million (2010: £1,647 million) was undrawn. Of the
total committed facilities £2,137 million (2010: £1,139 million) expires in less
than one year, £3,719 million (2010: £2,880 million) expires between two
and five years, and £1,296 million (2010: £1,740 million) expires in more than
five years.
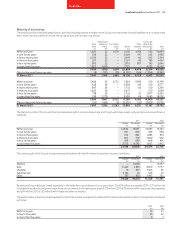
Redeemable preference shares
Redeemable preference shares comprise class D and E preferred shares
issued by Vodafone Americas, Inc. An annual dividend of US$51.43 per class
D and E preferred share is payable quarterly in arrears. The dividend for the
year amounted to £58 million (2010: £56 million). The aggregate redemption
value of the class D and E preferred shares is US$1.65 billion. The holders of
the preferred shares are entitled to vote on the election of directors and
upon each other matter coming before any meeting of the shareholders on
which the holders of ordinary shares are entitled to vote. Holders are entitled
to vote on the basis of twelve votes for each share of class D or E preferred
stock held. The maturity date of the 825,000 class D preferred shares is
6 April 2020. The 825,000 class E preferred shares have a maturity date of
1 April 2020. The class D and E preferred shares have a redemption price of
US$1,000 per share plus all accrued and unpaid dividends.
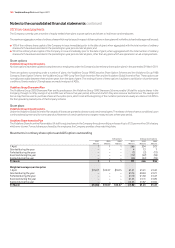
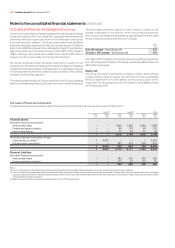
23. Post employment benets
Background
At 31 March 2011 the Group operated a number of pension plans for the
benefit of its employees throughout the world, which vary depending on the
conditions and practices in the countries concerned. The Group’s pension
plans are provided through both defined benefit and defined contribution
arrangements. Defined benefit schemes provide benefits based on the
employees’ length of pensionable service and their final pensionable salary
or other criteria. Defined contribution schemes offer employees individual
funds that are converted into benefits at the time of retirement.
The Group operates defined benefit schemes in Germany, Ghana, Greece,
India, Ireland, Italy, Turkey, the United Kingdom and the United States.
Defined contribution pension schemes are currently provided in Australia,
Egypt, Greece, Hungary, Ireland, Italy, Kenya, Malta, the Netherlands, New
Zealand, Portugal, South Africa, Spain and the United Kingdom. The Group’s
principal defined benefit pension scheme in the United Kingdom was closed
to new entrants from 1 January 2006 and closed to future accrual by current
members on 31 March 2010.
Income statement expense
2011 2010 2009
£m £m £m
Defined contribution schemes 130 110 73
Defined benefit schemes 4 50 40
Total amount charged to the
income statement (note 31) 134 160 113