Vodafone 2011 Annual Report Download - page 92
Download and view the complete annual report
Please find page 92 of the 2011 Vodafone annual report below. You can navigate through the pages in the report by either clicking on the pages listed below, or by using the keyword search tool below to find specific information within the annual report.-
 1
1 -
2
-
3
-
4
-
5
-
6
-
7
-
8
-
9
-
10
-
11
-
12
-
13
-
14
-
15
-
16
-
17
-
18
-
19
-
20
-
21
-
22
-
23
-
24
-
25
-
26
-
27
-
28
-
29
-
30
-
31
-
32
-
33
-
34
-
35
-
36
-
37
-
38
-
39
-
40
-
41
-
42
-
43
-
44
-
45
-
46
-
47
-
48
-
49
-
50
-
51
-
52
-
53
-
54
-
55
-
56
-
57
-
58
-
59
-
60
-
61
-
62
-
63
-
64
-
65
-
66
-
67
-
68
-
69
-
70
-
71
-
72
-
73
-
74
-
75
-
76
-
77
-
78
-
79
-
80
-
81
-
 82
82 -
 83
83 -
 84
84 -
 85
85 -
 86
86 -
 87
87 -
 88
88 -
 89
89 -
 90
90 -
 91
91 -
 92
92 -
 93
93 -
 94
94 -
 95
95 -
 96
96 -
 97
97 -
 98
98 -
 99
99 -
 100
100 -
 101
101 -
 102
102 -
103
-
104
-
105
-
106
-
107
-
108
-
109
-
110
-
111
-
112
-
113
-
114
-
115
-
116
-
117
-
118
-
119
-
120
-
121
-
122
-
123
-
124
-
125
-
126
-
127
-
128
-
129
-
130
-
131
-
132
-
133
-
134
-
135
-
136
-
137
-
138
-
139
-
140
-
141
-
142
-
143
-
144
-
145
-
146
-
147
-
148
-
149
-
150
-
151
-
152
-
153
-
154
-
155
-
156
 |
 |

90 Vodafone Group Plc Annual Report 2011
Notes to the consolidated nancial statements continued
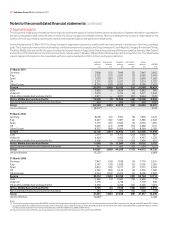
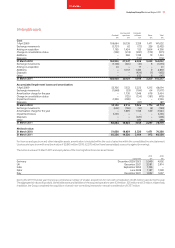
3. Segment analysis
The Group has a single group of related services and products being the supply of communications services and products. Segment information is provided on
the basis of geographic areas, being the basis on which the Group manages its worldwide interests. Revenue is attributed to a country or region based on the
location of the Group company reporting the revenue. Inter-segment sales are charged at arm’s length prices.
During the year ended 31 March 2011 the Group changed its organisation structure to enable continued improvement in the delivery of the Group’s strategic
goals. The Europe region now consists of all existing controlled businesses in Europe plus the Group’s interests in Czech Republic, Hungary, Romania and Turkey.
The Africa, Middle East and Asia Pacific region includes the Group’s interests in Egypt, India, Ghana, Kenya, Qatar and Vodacom as well as Australia, New Zealand
and Fiji. Non-Controlled Interests and Common Functions includes Verizon Wireless, SFR and Polkomtel as well as central Group functions. The tables below
present segment information on the revised basis, with prior years amended to conform to the current year presentation.
Segment Intra-region Regional Inter-region Group
revenue revenue revenue revenue revenue EBITDA(1)
£m £m £m £m £m £m
31 March 2011
Germany 7,900 (51) 7,849 (2) 7,847 2,952
Italy 5,722 (31) 5,691 (3) 5,688 2,643
Spain 5,133 (62) 5,071 (2) 5,069 1,562
UK 5,271 (50) 5,221 (7) 5,214 1,233
Other Europe 8,253 (70) 8,183 (3) 8,180 2,433
Europe 32,279 (264) 32,015 (17) 31,998 10,823
India 3,855 (1) 3,854 (11) 3,843 985
Vodacom 5,479 – 5,479 (8) 5,471 1,844
Other Africa, Middle East and Asia Pacific 3,971 – 3,971 (27) 3,944 1,170
Africa, Middle East and Asia Pacific 13,305 (1) 13,304 (46) 13,258 3,999
Non-Controlled Interests and Common Functions 659 – 659 (31) 628 (152)
Group 46,243 (265) 45,978 (94) 45,884 14,670
Verizon Wireless 18,711
(2)
7,313
31 March 2010
Germany 8,008 (41) 7,967 (8) 7,959 3,122
Italy 6,027 (40) 5,987 (2) 5,985 2,843
Spain 5,713 (81) 5,632 (2) 5,630 1,956
UK 5,025 (47) 4,978 (10) 4,968 1,141
Other Europe 8,357 (88) 8,269 (5) 8,264 2,582
Europe 33,130 (297) 32,833 (27) 32,806 11,644
India 3,114 (1) 3,113 (20) 3,093 807
Vodacom 4,450 – 4,450 (7) 4,443 1,528
Other Africa, Middle East and Asia Pacific 3,526 – 3,526 (30) 3,496 977
Africa, Middle East and Asia Pacific 11,090 (1) 11,089 (57) 11,032 3,312
Non-Controlled Interests and Common Functions 667 – 667 (33) 634 (221)
Group 44,887 (298) 44,589 (117) 44,472 14,735
Verizon Wireless 17,222
(2)
6,689
31 March 2009
Germany 7,847 (59) 7,788 (9) 7,779 3,225
Italy 5,547 (39) 5,508 (3) 5,505 2,565
Spain 5,812 (95) 5,717 (2) 5,715 2,034
UK 5,392 (48) 5,344 (8) 5,336 1,368
Other Europe 8,514 (102) 8,412 (3) 8,409 2,920
Europe 33,112 (343) 32,769 (25) 32,744 12,112
India 2,689 (2) 2,687 (18) 2,669 717
Vodacom 1,778 – 1,778 – 1,778 606
Other Africa, Middle East and Asia Pacific 3,258 – 3,258 (32) 3,226 1,072
Africa, Middle East and Asia Pacific 7,725 (2) 7,723 (50) 7,673 2,395
Non-Controlled Interests and Common Functions 614 – 614 (14) 600 (17)
Group 41,451 (345) 41,106 (89) 41,017 14,490
Verizon Wireless 14,085
(2)
5,543
Notes:
(1) The Group’s measure of segment profit, EBITDA, excludes the Group’s share of results in associates. The Group’s share of results in associates, by segment, for the year ended 31 March 2011 is Other
Europe £nil (2010: £nil; 2009 £(3) million), Vodacom £nil (2010: £(2) million; 2009: £(1) million), Other Africa, Middle East and Asia Pacific £51 million (2010: £56 million; 2009: £31 million) and Non-
Controlled Interests and Common Functions £5,008 million (2010: £4,688 million; 2009: £4,064 million).
(2) Values shown for Verizon Wireless, which is an associate, are not included in the calculation of Group revenue or EBITDA.