Vodafone 2011 Annual Report Download - page 95
Download and view the complete annual report
Please find page 95 of the 2011 Vodafone annual report below. You can navigate through the pages in the report by either clicking on the pages listed below, or by using the keyword search tool below to find specific information within the annual report.-
 1
1 -
2
-
3
-
4
-
5
-
6
-
7
-
8
-
9
-
10
-
11
-
12
-
13
-
14
-
15
-
16
-
17
-
18
-
19
-
20
-
21
-
22
-
23
-
24
-
25
-
26
-
27
-
28
-
29
-
30
-
31
-
32
-
33
-
34
-
35
-
36
-
37
-
38
-
39
-
40
-
41
-
42
-
43
-
44
-
45
-
46
-
47
-
48
-
49
-
50
-
51
-
52
-
53
-
54
-
55
-
56
-
57
-
58
-
59
-
60
-
61
-
62
-
63
-
64
-
65
-
66
-
67
-
68
-
69
-
70
-
71
-
72
-
73
-
74
-
75
-
76
-
77
-
78
-
79
-
80
-
81
-
82
-
83
-
84
-
 85
85 -
 86
86 -
 87
87 -
 88
88 -
 89
89 -
 90
90 -
 91
91 -
 92
92 -
 93
93 -
 94
94 -
 95
95 -
 96
96 -
 97
97 -
 98
98 -
 99
99 -
 100
100 -
 101
101 -
 102
102 -
 103
103 -
 104
104 -
 105
105 -
106
-
107
-
108
-
109
-
110
-
111
-
112
-
113
-
114
-
115
-
116
-
117
-
118
-
119
-
120
-
121
-
122
-
123
-
124
-
125
-
126
-
127
-
128
-
129
-
130
-
131
-
132
-
133
-
134
-
135
-
136
-
137
-
138
-
139
-
140
-
141
-
142
-
143
-
144
-
145
-
146
-
147
-
148
-
149
-
150
-
151
-
152
-
153
-
154
-
155
-
156
 |
 |
Vodafone Group Plc Annual Report 2011 93
Financials
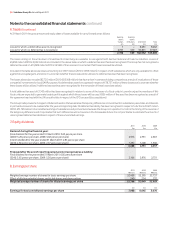
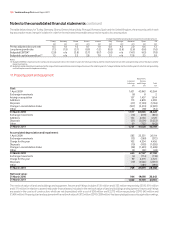
5. Investment income and nancing costs
2011 2010 2009
£m £m £m
Investment income:
Available-for-sale investments:
Dividends received 83 145 110
Loans and receivables at amortised cost 339 423 339
Gain on settlement of loans and receivables(1) 472 – –
Fair value through the income statement (held for trading):
Derivatives – foreign exchange contracts 38 3 71
Other(2) 263 92 275
Equity put rights and similar arrangements(3) 114 53 –
1,309 716 795
Financing costs:
Items in hedge relationships:
Other loans 746 888 782
Interest rate swaps (338) (464) (180)
Dividends on redeemable preference shares 58 56 53
Fair value hedging instrument (47) 228 (1,458)
Fair value of hedged item 40 (183) 1,475
Cash flow hedges transferred from equity 17 82 –
Other financial liabilities held at amortised cost:
Bank loans and overdrafts(4) 629 591 452
Other loans(5) 121 185 440
Potential interest on settlement of tax issues(6) (826) (178) (81)
Equity put rights and similar arrangements(3) 19 94 627
Finance leases 9 7 1
Fair value through the income statement (held for trading):
Derivatives – forward starting swaps and futures 1 206 308
429 1,512 2,419
Net (investment income)/financing costs (880) 796 1,624
Notes:
(1) Gain on settlement of loans and receivables issued by SoftBank Mobile Corp.
(2) Amounts include foreign exchange gains on investments held following the disposal of Vodafone Japan to SoftBank Corp. and for 2011, foreign exchange gains on net investment in foreign operations.
(3) Includes amounts in relation to the Group’s arrangements with its minority partners in India.
(4) The Group capitalised £138 million of interest expense in the year (2010: £1 million; 2009: £nil). The capitalisation rate used to determine the amount of borrowing costs eligible for capitalisation was 9.8%.
(5) Amount for 2010 includes £48 million (2009: £94 million) of foreign exchange losses arising from net investments in foreign operations.
(6) Amounts for 2011, 2010 and 2009 include a reduction of the provision for potential interest on tax issues.