Vodafone 2011 Annual Report Download - page 83
Download and view the complete annual report
Please find page 83 of the 2011 Vodafone annual report below. You can navigate through the pages in the report by either clicking on the pages listed below, or by using the keyword search tool below to find specific information within the annual report.-
 1
1 -
2
-
3
-
4
-
5
-
6
-
7
-
8
-
9
-
10
-
11
-
12
-
13
-
14
-
15
-
16
-
17
-
18
-
19
-
20
-
21
-
22
-
23
-
24
-
25
-
26
-
27
-
28
-
29
-
30
-
31
-
32
-
33
-
34
-
35
-
36
-
37
-
38
-
39
-
40
-
41
-
42
-
43
-
44
-
45
-
46
-
47
-
48
-
49
-
50
-
51
-
52
-
53
-
54
-
55
-
56
-
57
-
58
-
59
-
60
-
61
-
62
-
63
-
64
-
65
-
66
-
67
-
68
-
69
-
70
-
71
-
72
-
 73
73 -
 74
74 -
 75
75 -
 76
76 -
 77
77 -
 78
78 -
 79
79 -
 80
80 -
 81
81 -
 82
82 -
 83
83 -
 84
84 -
 85
85 -
 86
86 -
 87
87 -
 88
88 -
 89
89 -
 90
90 -
 91
91 -
 92
92 -
 93
93 -
94
-
95
-
96
-
97
-
98
-
99
-
100
-
101
-
102
-
103
-
104
-
105
-
106
-
107
-
108
-
109
-
110
-
111
-
112
-
113
-
114
-
115
-
116
-
117
-
118
-
119
-
120
-
121
-
122
-
123
-
124
-
125
-
126
-
127
-
128
-
129
-
130
-
131
-
132
-
133
-
134
-
135
-
136
-
137
-
138
-
139
-
140
-
141
-
142
-
143
-
144
-
145
-
146
-
147
-
148
-
149
-
150
-
151
-
152
-
153
-
154
-
155
-
156
 |
 |
Vodafone Group Plc Annual Report 2011 81
Financials
2011 2010
Note £m £m
Non-current assets
Goodwill 9 45,236 51,838
Other intangible assets 9 23,322 22,420
Property, plant and equipment 11 20,181 20,642
Investments in associates 14 38,105 36,377
Other investments 15 1,381 7,591
Deferred tax assets 6 2,018 1,033
Post employment benefits 23 97 34
Trade and other receivables 17 3,877 2,831
134,217 142,766
Current assets
Inventory 16 537 433
Taxation recoverable 281 191
Trade and other receivables 17 9,259 8,784
Other investments 15 674 388
Cash and cash equivalents 18 6,252 4,423
17,003 14,219
Total assets 151,220 156,985
Equity
Called up share capital 19 4,082 4,153
Additional paid-in capital 153,760 153,509
Treasury shares (8,171) (7,810)
Retained losses (77,661) (79,655)
Accumulated other comprehensive income 15,545 20,184
Total equity shareholders’ funds 87,555 90,381
Non-controlling interests 2,880 3,379
Put options over non-controlling interests (2,874) (2,950)
Total non-controlling interests 6 429
Total equity 87,561 90,810
Non-current liabilities
Long-term borrowings 22 28,375 28,632
Taxation liabilities 350 –
Deferred tax liabilities 6 6,486 7,377
Post employment benefits 23 87 237
Provisions 24 482 497
Trade and other payables 25 804 816
36,584 37,559
Current liabilities
Short-term borrowings 22 9,906 11,163
Taxation liabilities 1,912 2,874
Provisions 24 559 497
Trade and other payables 25 14,698 14,082
27,075 28,616
Total equity and liabilities 151,220 156,985
The consolidated financial statements were approved by the Board of directors and authorised for issue on 17 May 2011 and were signed on its behalf by:
Vittorio Colao Andy Halford
Chief Executive Chief Financial Officer
The accompanying notes are an integral part of these consolidated financial statements.
at 31 March
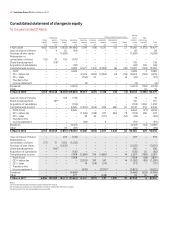
Consolidated statement of nancial position