Vodafone 2011 Annual Report Download - page 67
Download and view the complete annual report
Please find page 67 of the 2011 Vodafone annual report below. You can navigate through the pages in the report by either clicking on the pages listed below, or by using the keyword search tool below to find specific information within the annual report.-
 1
1 -
2
-
3
-
4
-
5
-
6
-
7
-
8
-
9
-
10
-
11
-
12
-
13
-
14
-
15
-
16
-
17
-
18
-
19
-
20
-
21
-
22
-
23
-
24
-
25
-
26
-
27
-
28
-
29
-
30
-
31
-
32
-
33
-
34
-
35
-
36
-
37
-
38
-
39
-
40
-
41
-
42
-
43
-
44
-
45
-
46
-
47
-
48
-
49
-
50
-
51
-
52
-
53
-
54
-
55
-
56
-
 57
57 -
 58
58 -
 59
59 -
 60
60 -
 61
61 -
 62
62 -
 63
63 -
 64
64 -
 65
65 -
 66
66 -
 67
67 -
 68
68 -
 69
69 -
 70
70 -
 71
71 -
 72
72 -
 73
73 -
 74
74 -
 75
75 -
 76
76 -
 77
77 -
78
-
79
-
80
-
81
-
82
-
83
-
84
-
85
-
86
-
87
-
88
-
89
-
90
-
91
-
92
-
93
-
94
-
95
-
96
-
97
-
98
-
99
-
100
-
101
-
102
-
103
-
104
-
105
-
106
-
107
-
108
-
109
-
110
-
111
-
112
-
113
-
114
-
115
-
116
-
117
-
118
-
119
-
120
-
121
-
122
-
123
-
124
-
125
-
126
-
127
-
128
-
129
-
130
-
131
-
132
-
133
-
134
-
135
-
136
-
137
-
138
-
139
-
140
-
141
-
142
-
143
-
144
-
145
-
146
-
147
-
148
-
149
-
150
-
151
-
152
-
153
-
154
-
155
-
156
 |
 |

Vodafone Group Plc Annual Report 2011 65
Governance
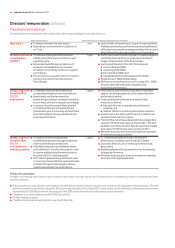
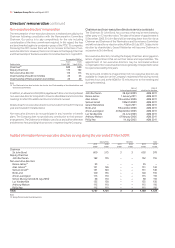
Awards made to executive directors during the 2011 nancial year
Reward elements Vittorio Colao Andy Halford Michel Combes Stephen Pusey
Base salary Vittorio’s base salary was
increased from £975,000
to £1,065,000 in July 2010.
Andy’s base salary was
increased from £674,100
to £700,000 in July 2010.
Michel’s base salary was
increased from £740,000
to £770,000 in July 2010.
Stephen’s base salary was
increased from £500,000
to £550,000 in July 2010.
Annual bonus The target bonus was
£1,065,000 and the
maximum bonus was
£2,130,000.
The target bonus was
£700,000 and the
maximum bonus was
£1,400,000.
The target bonus was
£770,000 and the
maximum bonus was
£1,540,000
The target bonus was
£550,000 and the
maximum bonus was
£1,100,000.
Long-term incentive
plan
In June 2010 the base
award had a face value
of 137.5% of base salary
at target performance.
In June 2010 the base
award had a face value
of 110% of base salary
at target performance.
In June 2010 the base
award had a face value
of 110% of base salary
at target performance.
In June 2010 the base
award had a face value
of 110% of base salary
at target performance.
Investment opportunity Vittorio invested the
maximum into the GLTI
plan (731,796 shares)
and therefore received
a matching award with
a face value of 100% of
base salary at target.
Andy invested the
maximum into the GLTI
plan (506,910 shares)
and therefore received
a matching award with
a face value of 100% of
base salary at target.
Michel invested 53% of
the maximum into the
GLTI plan (275,960 shares)
and therefore received a
matching award with a
face value of 53% of base
salary at target.
Stephen invested 37%
of the maximum into the
GLTI plan (141,834 shares)
and therefore received
a matching award with a
face value of 37% of base
salary at target.
Pay and performance for the 2012 nancial year
The Remuneration Committee considers the remuneration increases for the different groups of employees across all of our local markets and other
relevant factors when assessing the pay of the executive directors. During its regular review of total compensation in March 2011, the Remuneration
Committee decided that due to an improvement in business performance, with a return to revenue growth, and continued focus on profit and strong cash
flow, that modest salary increases for the executive directors would be appropriate. Individual increases will become effective from 1 July 2011 and are
set out in the table on page 67. When determining these increases the Remuneration Committee took into account the general increases in each of the
major markets. It should be noted that the average increase for the executive directors is 2.8% and for the whole of the Executive Committee it is 3% which
is in line with increases in the rest of the Group based in the UK.
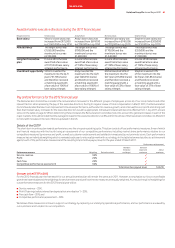
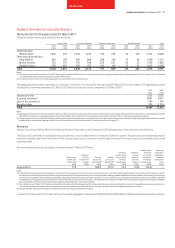
Details of the GSTIP
The short-term incentive plan rewards performance over the one year operating cycle. This plan consists of four performance measures, three of which
are financial measures with the fourth being an assessment of our competitive performance including market share performance relative to our
competitors measured by revenue and profit, as well as customer endorsement and satisfaction measured by net promoter score. Each performance
measure has an individual weighting which is reviewed each year to ensure alignment with our strategy. In the table below we describe our achievement
against each of the performance measures and the resulting total incentive payout level for the year ended 31 March 2011.
Performance achievement
Performance measure Weighting Below threshold
Between
threshold
and target
Between
target and
maximum
Above
maximum
Service revenue 30% ✓
Profit 20% ✓
Cash flow 20% ✓
Competitive performance assessment 30% ✓
Total incentive payout level 124.2%
Changes to the GSTIP in 2012
For the 2012 financial year the framework for our annual incentive plan will remain the same as in 2011. However, to emphasise our focus on profitable
growth we have rebalanced the weightings for service revenue and profit so the two measures are equally weighted. As a result, the split of weightings for
our performance measures for the 2012 financial year will be:
■ Service revenue – 25%;
■ Profit (“earnings before interest tax depreciation amortisation”) – 25%;
■ Free cash flow – 20%; and
■ Competitive performance assessment – 30%.
We believe these measures continue to support our strategy by capturing our underlying operational performance, and our performance as viewed by
our customers and in relation to our competition.