Vodafone 2011 Annual Report Download - page 106
Download and view the complete annual report
Please find page 106 of the 2011 Vodafone annual report below. You can navigate through the pages in the report by either clicking on the pages listed below, or by using the keyword search tool below to find specific information within the annual report.-
 1
1 -
2
-
3
-
4
-
5
-
6
-
7
-
8
-
9
-
10
-
11
-
12
-
13
-
14
-
15
-
16
-
17
-
18
-
19
-
20
-
21
-
22
-
23
-
24
-
25
-
26
-
27
-
28
-
29
-
30
-
31
-
32
-
33
-
34
-
35
-
36
-
37
-
38
-
39
-
40
-
41
-
42
-
43
-
44
-
45
-
46
-
47
-
48
-
49
-
50
-
51
-
52
-
53
-
54
-
55
-
56
-
57
-
58
-
59
-
60
-
61
-
62
-
63
-
64
-
65
-
66
-
67
-
68
-
69
-
70
-
71
-
72
-
73
-
74
-
75
-
76
-
77
-
78
-
79
-
80
-
81
-
82
-
83
-
84
-
85
-
86
-
87
-
88
-
89
-
90
-
91
-
92
-
93
-
94
-
95
-
 96
96 -
 97
97 -
 98
98 -
 99
99 -
 100
100 -
 101
101 -
 102
102 -
 103
103 -
 104
104 -
 105
105 -
 106
106 -
 107
107 -
 108
108 -
 109
109 -
 110
110 -
 111
111 -
 112
112 -
 113
113 -
 114
114 -
 115
115 -
 116
116 -
117
-
118
-
119
-
120
-
121
-
122
-
123
-
124
-
125
-
126
-
127
-
128
-
129
-
130
-
131
-
132
-
133
-
134
-
135
-
136
-
137
-
138
-
139
-
140
-
141
-
142
-
143
-
144
-
145
-
146
-
147
-
148
-
149
-
150
-
151
-
152
-
153
-
154
-
155
-
156
 |
 |

104 Vodafone Group Plc Annual Report 2011
Notes to the consolidated nancial statements continued
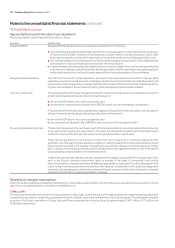
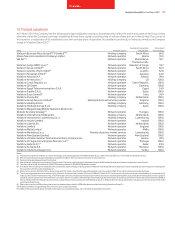
13. Investments in joint ventures
Principal joint ventures
At 31 March 2011 the Company had the following joint ventures carrying on businesses which affect the profits and assets of the Group. Unless otherwise
stated the Company’s principal joint ventures all have share capital consisting solely of ordinary shares, which are indirectly held, and the country of
incorporation or registration is also their principal place of operation.
Country of incorporation Percentage(1)
Name Principal activity or registration shareholdings
Indus Towers Limited Network infrastructure India 25.2(2)
Polkomtel S.A.(3) Network operator Poland 24.4
Vodafone Hutchison Australia Pty Limited(3) Network operator Australia 50.0
Vodafone Fiji Limited Network operator Fiji 49.0(4)
Vodafone Omnitel N.V.(5) Network operator Netherlands 76.9(6)
Notes:
(1) Rounded to nearest tenth of one percent.
(2) Vodafone Essar Limited, in which the Group has a 59.9% equity interest, owns 42.0% of Indus Towers Limited.
(3) Polkomtel S.A. and Vodafone Hutchinson Australia Pty Limited have a year end of 31 December.
(4) The Group holds substantive participating rights which provide it with a veto over the significant financial and operating policies of Vodafone Fiji Limited and which ensure it is able to exercise joint
control over Vodafone Fiji Limited with the majority shareholder.
(5) The principal place of operation of Vodafone Omnitel N.V. is Italy.
(6) The Group considered the existence of substantive participating rights held by the non-controlling shareholder provide that shareholder with a veto right over the significant financial and operating
policies of Vodafone Omnitel N.V., and determined that, as a result of these rights, the Group does not have control over the financial and operating policies of Vodafone Omnitel N.V., despite the Group’s
76.9% ownership interest.
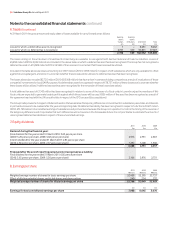
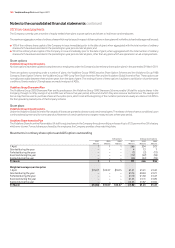
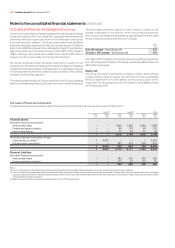
Effect of proportionate consolidation of joint ventures
The following table presents, on a condensed basis, the effect on the consolidated financial statements of including joint ventures using proportionate
consolidation. The results of Vodacom Group Limited are included until 18 May 2009 when it became a subsidiary and the results of Safaricom Limited
(‘Safaricom’) are included until 28 May 2008, at which time its consolidation status changed from joint venture to associate. The results of Australia are
included from 9 June 2009 following its merger with Hutchison 3G Australia and results from the 4.8% stake in Polkomtel acquired during the 2009
financial year are included from 18 December 2008.
2011 2010 2009
£m £m £m
Revenue 7,849 7,896 7,737
Cost of sales (4,200) (4,216) (4,076)
Gross profit 3,649 3,680 3,661
Selling, distribution and administrative expenses (1,624) (1,369) (1,447)
Impairment losses (1,050) – –
Operating income and expense – (12) –
Operating profit 975 2,299 2,214
Net financing costs (146) (152) (170)
Profit before tax 829 2,147 2,044
Income tax expense (608) (655) (564)
Profit for the financial year 221 1,492 1,480
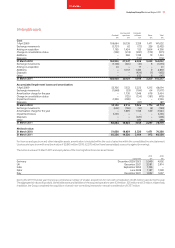
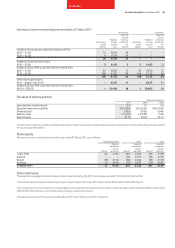
2011 2010
£m £m
Non-current assets 19,043 20,787
Current assets 1,908 763
Total assets 20,951 21,550
Total shareholders’ funds and total equity 16,389 17,407
Non-current liabilities 1,887 833
Current liabilities 2,675 3,310
Total liabilities 4,562 4,143
Total equity and liabilities 20,951 21,550