Vodafone 2011 Annual Report Download - page 6
Download and view the complete annual report
Please find page 6 of the 2011 Vodafone annual report below. You can navigate through the pages in the report by either clicking on the pages listed below, or by using the keyword search tool below to find specific information within the annual report.-
 1
1 -
 2
2 -
 3
3 -
 4
4 -
 5
5 -
 6
6 -
 7
7 -
 8
8 -
 9
9 -
 10
10 -
 11
11 -
 12
12 -
 13
13 -
 14
14 -
 15
15 -
 16
16 -
 17
17 -
18
-
19
-
20
-
21
-
22
-
23
-
24
-
25
-
26
-
27
-
28
-
29
-
30
-
31
-
32
-
33
-
34
-
35
-
36
-
37
-
38
-
39
-
40
-
41
-
42
-
43
-
44
-
45
-
46
-
47
-
48
-
49
-
50
-
51
-
52
-
53
-
54
-
55
-
56
-
57
-
58
-
59
-
60
-
61
-
62
-
63
-
64
-
65
-
66
-
67
-
68
-
69
-
70
-
71
-
72
-
73
-
74
-
75
-
76
-
77
-
78
-
79
-
80
-
81
-
82
-
83
-
84
-
85
-
86
-
87
-
88
-
89
-
90
-
91
-
92
-
93
-
94
-
95
-
96
-
97
-
98
-
99
-
100
-
101
-
102
-
103
-
104
-
105
-
106
-
107
-
108
-
109
-
110
-
111
-
112
-
113
-
114
-
115
-
116
-
117
-
118
-
119
-
120
-
121
-
122
-
123
-
124
-
125
-
126
-
127
-
128
-
129
-
130
-
131
-
132
-
133
-
134
-
135
-
136
-
137
-
138
-
139
-
140
-
141
-
142
-
143
-
144
-
145
-
146
-
147
-
148
-
149
-
150
-
151
-
152
-
153
-
154
-
155
-
156
 |
 |
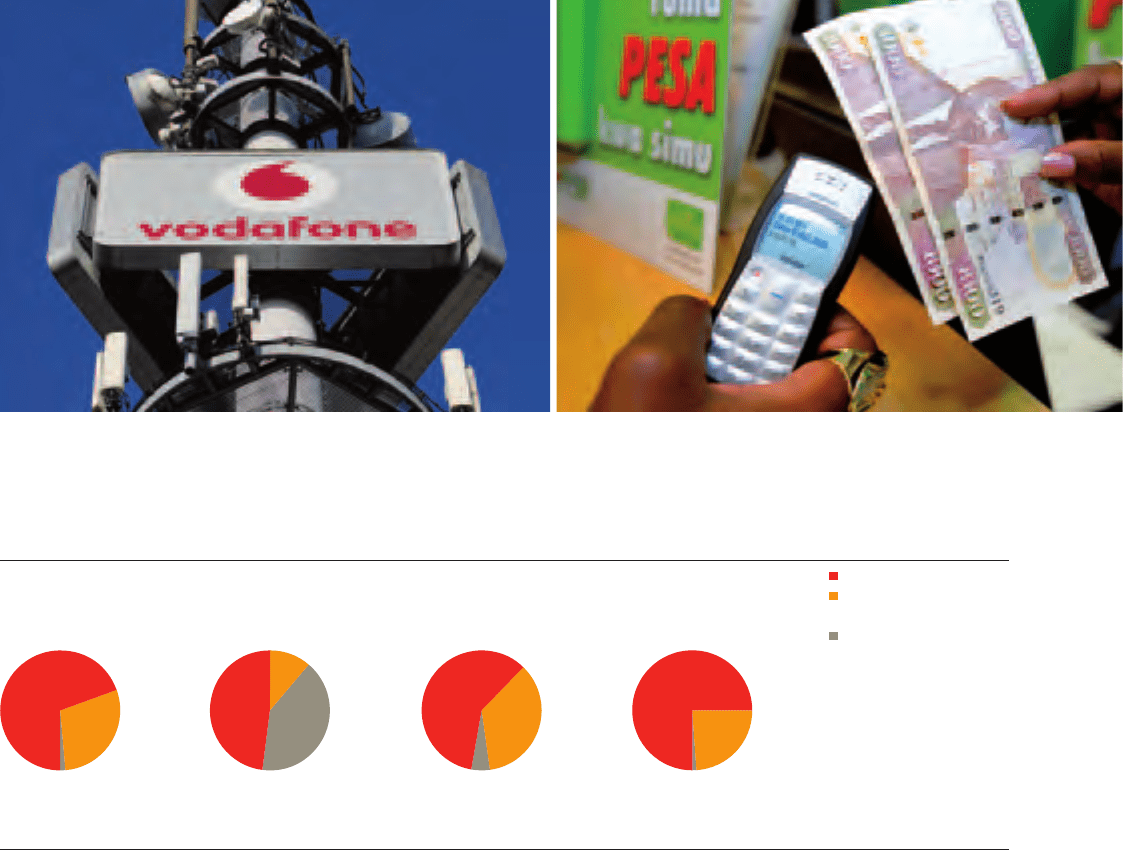
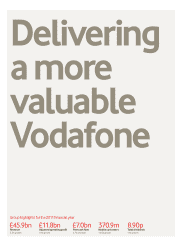
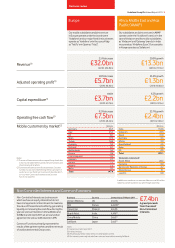
Revenue
(£bn)
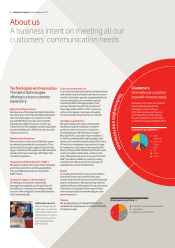
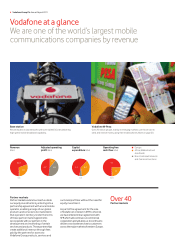
Vodafone at a glance
We are one of the world’s largest mobile
communications companies by revenue
Vodafone M-Pesa
Over 20 million people, mainly in emerging markets, use this service to
send and receive money using their mobile phones. More on page 20.
Capital
expenditure (£bn)
Adjusted operating
profit (£bn)
Operating free
cash flow (£bn)
Base station
We are leaders in data networks with over 66,000 3G sites delivering
high speed mobile broadband capability.
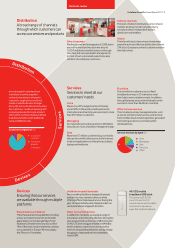
Europe
Africa, Middle East and
Asia Pacific
Non-Controlled Interests
and Common Functions
0.6
4.8
0.3 (0.1)
13.3
1.3
2.2
2.4
32.0
5.7 3.7
7.5
Partner markets
Partner markets extend our reach outside
our equity investments by entering into a
partnership agreement with a local mobile
operator, enabling a range of our global
products and services to be marketed in
that operator’s territory. Under the terms
of these partner market agreements
we cooperate with our partners in the
development and marketing of certain
services and products. These partnerships
create additional revenue through fees
paid by the partners for access to
Vodafone Group products, services and
Over 40
Partner markets
our brand portfolio without the need for
equity investment.
As part of the agreement for the sale
of Vodafone’s interest in SFR to Vivendi,
we have entered into an agreement with
SFR which will continue our commercial
cooperation and will allow us to continue to
deliver cross-border services to customers
across the major markets of western Europe.
4 Vodafone Group Plc Annual Report 2011