Vodafone 2011 Annual Report Download - page 46
Download and view the complete annual report
Please find page 46 of the 2011 Vodafone annual report below. You can navigate through the pages in the report by either clicking on the pages listed below, or by using the keyword search tool below to find specific information within the annual report.-
 1
1 -
2
-
3
-
4
-
5
-
6
-
7
-
8
-
9
-
10
-
11
-
12
-
13
-
14
-
15
-
16
-
17
-
18
-
19
-
20
-
21
-
22
-
23
-
24
-
25
-
26
-
27
-
28
-
29
-
30
-
31
-
32
-
33
-
34
-
35
-
 36
36 -
 37
37 -
 38
38 -
 39
39 -
 40
40 -
 41
41 -
 42
42 -
 43
43 -
 44
44 -
 45
45 -
 46
46 -
 47
47 -
 48
48 -
 49
49 -
 50
50 -
 51
51 -
 52
52 -
 53
53 -
 54
54 -
 55
55 -
 56
56 -
57
-
58
-
59
-
60
-
61
-
62
-
63
-
64
-
65
-
66
-
67
-
68
-
69
-
70
-
71
-
72
-
73
-
74
-
75
-
76
-
77
-
78
-
79
-
80
-
81
-
82
-
83
-
84
-
85
-
86
-
87
-
88
-
89
-
90
-
91
-
92
-
93
-
94
-
95
-
96
-
97
-
98
-
99
-
100
-
101
-
102
-
103
-
104
-
105
-
106
-
107
-
108
-
109
-
110
-
111
-
112
-
113
-
114
-
115
-
116
-
117
-
118
-
119
-
120
-
121
-
122
-
123
-
124
-
125
-
126
-
127
-
128
-
129
-
130
-
131
-
132
-
133
-
134
-
135
-
136
-
137
-
138
-
139
-
140
-
141
-
142
-
143
-
144
-
145
-
146
-
147
-
148
-
149
-
150
-
151
-
152
-
153
-
154
-
155
-
156
 |
 |

44 Vodafone Group Plc Annual Report 2011
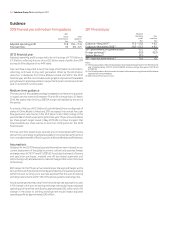
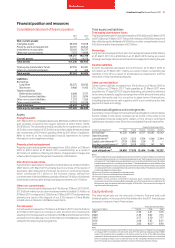
Guidance
2012 nancial year and medium-term guidance
2011
actual 2012
performance guidance
£bn £bn
Adjusted operating profit 11.8 11.0 – 11.8
Free cash flow 7.0 6.0 – 6.5
2012 nancial year
Adjusted operating profit is expected to be in the range of £11.0 billion to
£11.8 billion, reflecting the loss of our £0.5 billion share of profits from SFR
as a result of the disposal of our 44% stake.
Free cash flow is expected to be in the range of £6.0 billion to £6.5 billion,
reflecting continued strong cash generation offset by the £0.3 billion
reduction in dividends from China Mobile Limited and SFR in the 2012
financial year, and the more limited working capital improvements available
going forward. Capital expenditure is expected to be at a similar level to last
year on a constant currency basis.
Medium-term guidance
The execution of the updated strategy is targeted to achieve annual growth
in organic service revenue of between 1% and 4% in the period to 31 March
2014. We expect that the Group EBITDA margin will stabilise by the end of
this period.
As a result of the loss of £0.5 billion of cash dividends from our disposals of
stakes in China Mobile Limited and SFR, we expect that annual free cash
flow generation will now be in the £5.5 billion to £6.5 billion range in the
period to March 2014, underpinning the three year 7% per annum dividend
per share growth target issued in May 2010. We continue to expect that
total dividends per share will be no less than 10.18 pence for the 2013
financial year.
The free cash flow target range excludes any incremental benefit that we
derive from our strategy to generate liquidity or incremental cash flow from
non-controlled interests of the Group such as Verizon Wireless and Polkomtel.
Assumptions
Guidance for the 2012 financial year and the medium-term is based on our
current assessment of the global economic outlook and assumes foreign
exchange rates of £1:€1.15 and £1:US$1.60. It excludes the impact of licence
and spectrum purchases, material one-off tax related payments and
restructuring costs and assumes no material change to the current structure
of the Group.
With respect to the 7% per annum dividend per share growth target, as the
Group’s free cash flow is predominantly generated by companies operating
within the euro currency zone, we have assumed that the euro to sterling
exchange rate remains within 10% of the above guidance exchange rate.
Actual exchange rates may vary from the exchange rate assumptions used.
A 1% change in the euro to sterling exchange rate would impact adjusted
operating profit and free cash flow by approximately £50 million and a 1%
change in the dollar to sterling exchange rate would impact adjusted
operating profit by approximately £50 million.
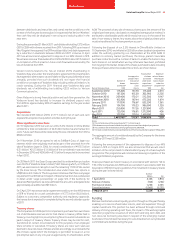
2011 nancial year
Adjusted
operating Free
profit cash flow
£bn £bn
Guidance – May 2010(1) 11.2 – 12.0 > 6.5
Guidance – November 2010(1) 11.8 – 12.2 > 6.5
2011 performance on guidance basis(3) 12.2 7.2
Foreign exchange(1) (0.3) (0.2)
Verizon Wireless(2) (0.1) –
2011 reported performance(3) 11.8 7.0
Notes:
(1) The Group’s guidance reflected assumptions for average exchange rates for the 2011 financial
year of approximately £1:€1.15 and £1:US$1.50. Actual exchange rates were £1:€1.18 and
£1:US$1.56.
(2) The Group’s guidance did not include the impact of the revenue recognition and Alltel related
adjustments in Verizon Wireless.
(3) After Verizon iPhone launch costs.