Vodafone 2011 Annual Report Download - page 109
Download and view the complete annual report
Please find page 109 of the 2011 Vodafone annual report below. You can navigate through the pages in the report by either clicking on the pages listed below, or by using the keyword search tool below to find specific information within the annual report.-
 1
1 -
2
-
3
-
4
-
5
-
6
-
7
-
8
-
9
-
10
-
11
-
12
-
13
-
14
-
15
-
16
-
17
-
18
-
19
-
20
-
21
-
22
-
23
-
24
-
25
-
26
-
27
-
28
-
29
-
30
-
31
-
32
-
33
-
34
-
35
-
36
-
37
-
38
-
39
-
40
-
41
-
42
-
43
-
44
-
45
-
46
-
47
-
48
-
49
-
50
-
51
-
52
-
53
-
54
-
55
-
56
-
57
-
58
-
59
-
60
-
61
-
62
-
63
-
64
-
65
-
66
-
67
-
68
-
69
-
70
-
71
-
72
-
73
-
74
-
75
-
76
-
77
-
78
-
79
-
80
-
81
-
82
-
83
-
84
-
85
-
86
-
87
-
88
-
89
-
90
-
91
-
92
-
93
-
94
-
95
-
96
-
97
-
98
-
 99
99 -
 100
100 -
 101
101 -
 102
102 -
 103
103 -
 104
104 -
 105
105 -
 106
106 -
 107
107 -
 108
108 -
 109
109 -
 110
110 -
 111
111 -
 112
112 -
 113
113 -
 114
114 -
 115
115 -
 116
116 -
 117
117 -
 118
118 -
 119
119 -
120
-
121
-
122
-
123
-
124
-
125
-
126
-
127
-
128
-
129
-
130
-
131
-
132
-
133
-
134
-
135
-
136
-
137
-
138
-
139
-
140
-
141
-
142
-
143
-
144
-
145
-
146
-
147
-
148
-
149
-
150
-
151
-
152
-
153
-
154
-
155
-
156
 |
 |
Vodafone Group Plc Annual Report 2011 107
Financials
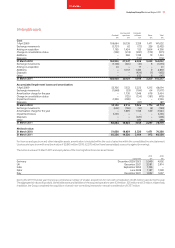
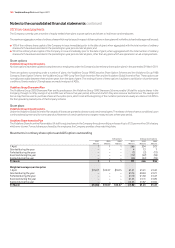
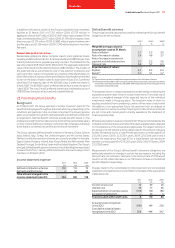
18. Cash and cash equivalents
2011 2010
£m £m
Cash at bank and in hand 896 745
Money market funds 5,015 3,678
Other 341 –
Cash and cash equivalents as presented in the statement of financial position 6,252 4,423
Bank overdrafts (47) (60)
Cash and cash equivalents as presented in the statement of cash flows 6,205 4,363
Bank balances and money market funds comprise cash held by the Group on a short-term basis with original maturity of three months or less. The carrying
amount of cash and cash equivalents approximates their fair value.
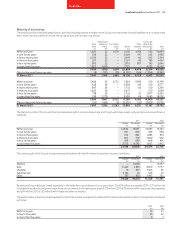
19. Called up share capital
2011 2010
Number £m Number £m
Ordinary shares of 113/7 US cents each allotted, issued and fully paid:(1)(2)
1 April 57,809,246,732 4,153 57,806,283,716 4,153
Allotted during the year 1,876,697 – 2,963,016 –
Cancelled during the year (1,000,000,000) (71) – –
31 March 56,811,123,429 4,082 57,809,246,732 4,153
Notes:
(1) The concept of authorised share capital was abolished under the Companies Act 2006, with effect from 1 October 2009, and consequential amendments to the Company’s articles of association
removing all references to authorised share capital were approved by shareholders at the 2010 annual general meeting.
(2) At 31 March 2011 the Group held 5,233,597,599 (2010: 5,146,112,159) treasury shares with a nominal value of £376 million (2010: £370 million). The market value of shares held was £9,237 million
(2010: £7,822 million). During the year 150,404,079 (2010: 149,298,942) treasury shares were reissued under Group share option schemes.
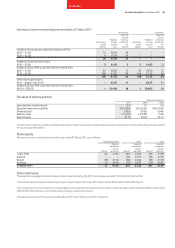
Allotted during the year
Nominal Net
value proceeds
Number £m £m
UK share awards and option scheme awards 35,557 – –
US share awards and option scheme awards 1,841,140 – 3
Total for share awards and option scheme awards 1,876,697 – 3