Vodafone 2011 Annual Report Download - page 44
Download and view the complete annual report
Please find page 44 of the 2011 Vodafone annual report below. You can navigate through the pages in the report by either clicking on the pages listed below, or by using the keyword search tool below to find specific information within the annual report.-
 1
1 -
2
-
3
-
4
-
5
-
6
-
7
-
8
-
9
-
10
-
11
-
12
-
13
-
14
-
15
-
16
-
17
-
18
-
19
-
20
-
21
-
22
-
23
-
24
-
25
-
26
-
27
-
28
-
29
-
30
-
31
-
32
-
33
-
 34
34 -
 35
35 -
 36
36 -
 37
37 -
 38
38 -
 39
39 -
 40
40 -
 41
41 -
 42
42 -
 43
43 -
 44
44 -
 45
45 -
 46
46 -
 47
47 -
 48
48 -
 49
49 -
 50
50 -
 51
51 -
 52
52 -
 53
53 -
 54
54 -
55
-
56
-
57
-
58
-
59
-
60
-
61
-
62
-
63
-
64
-
65
-
66
-
67
-
68
-
69
-
70
-
71
-
72
-
73
-
74
-
75
-
76
-
77
-
78
-
79
-
80
-
81
-
82
-
83
-
84
-
85
-
86
-
87
-
88
-
89
-
90
-
91
-
92
-
93
-
94
-
95
-
96
-
97
-
98
-
99
-
100
-
101
-
102
-
103
-
104
-
105
-
106
-
107
-
108
-
109
-
110
-
111
-
112
-
113
-
114
-
115
-
116
-
117
-
118
-
119
-
120
-
121
-
122
-
123
-
124
-
125
-
126
-
127
-
128
-
129
-
130
-
131
-
132
-
133
-
134
-
135
-
136
-
137
-
138
-
139
-
140
-
141
-
142
-
143
-
144
-
145
-
146
-
147
-
148
-
149
-
150
-
151
-
152
-
153
-
154
-
155
-
156
 |
 |

42 Vodafone Group Plc Annual Report 2011
Operating results continued
Other Europe
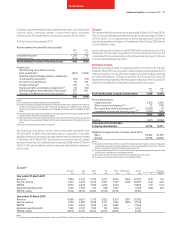
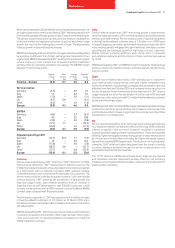
Service revenue decreased by 6.0%(*) with declines in all countries except the Netherlands and Turkey, which returned to growth in the second half of the
year, as all markets were impacted by the economic downturn. In the Netherlands service revenue increased 3.0%(*) benefiting from strong growth in visitor
revenue. Service revenue in Turkey increased by 31.3%(*) in the fourth quarter driven by an improving trend in outgoing mobile revenue. The quality and
mix of customers continued to improve, with Vodafone remaining the market leader in mobile number portability in Turkey. In Romania service revenue
declined by 19.9%(*) due to intense competition throughout the year, mobile termination rate cuts and the continued impact on ARPU resulting from local
currency devaluation against the euro, as tariffs are quoted in euros while household incomes are earned in local currency. In the Czech Republic and
Hungary the decline in service revenue was driven by mobile termination rate cuts which became effective during the year, impacting incoming mobile
voice revenue and challenging economic conditions. Vodafone launched its 3G network services in the Czech Republic during the fourth quarter. Service
revenue in Greece declined by 14.5%(*) primarily due to a mobile termination rate cut effective from January 2009, tariff changes and a particularly tough
economic and competitive climate. Service revenue in Ireland declined due to a combination of recessionary and competitive factors. In Portugal there
was a termination rate reduction effective from April 2009 which contributed to a fall in service revenue of 4.9%(*).
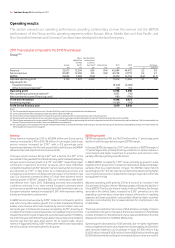
EBITDA declined by 16.0%(*) mainly due to a reduction in service revenue coupled with turnaround investment in Turkey. The significant service revenue
growth in the second half of the financial year in Turkey was driven by investment and improvement in many areas of the business. These led to higher
operating costs which, when coupled with increased interconnect costs arising from the introduction of new “any network” tariffs plans, resulted in
negative EBITDA for the financial year. In Romania EBITDA decreased by 26.5%(*) due to the revenue decline but this was partially offset by strong cost
reduction initiatives in all areas. The EBITDA margin fell by 3.4 percentage points with declines in all markets except the Netherlands, Portugal, Czech
Republic and Hungary. The decline in service revenue was partially offset by lower customer costs and a reduction in operating expenses.
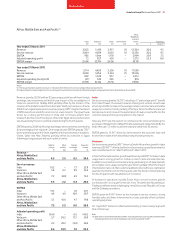
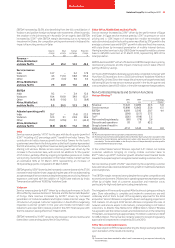
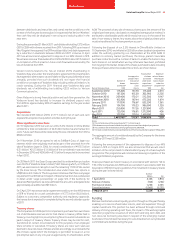
Africa, Middle East and Asia Pacic
Africa,
Middle East
and Asia
India Vodacom Other Eliminations Pacific % change
£m £m £m £m £m £ Organic(1)
Year ended 31 March 2010
Revenue 3,114 4,450 3,526 (1) 11,089 43.6 6.1
Service revenue 3,069 3,954 3,224 (1) 10,246 44.2 7.5
EBITDA 807 1,528 977 – 3,312 38.3 5.5
Adjusted operating profit (37) 520 335 – 818 (11.4) (0.3)
EBITDA margin 25.9% 34.3% 27.7% 29.9%
Year ended 31 March 2009
Revenue 2,689 1,778 3,258 (2) 7,723
Service revenue 2,604 1,548 2,953 (2) 7,103
EBITDA 717 606 1,072 – 2,395
Adjusted operating profit (30) 373 580 – 923
EBITDA margin 26.7% 34.1% 32.9% 31.0%
Note:
(1) Organic growth includes Vodacom (except the results of Gateway) at the current level of ownership and includes India but excludes Australia following the merger with Hutchison 3G Australia on
9 June 2009.
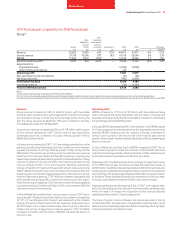
Revenue increased by 43.6% benefiting from the treatment of Vodacom as a subsidiary and the full consolidation of its results from 18 May 2009 combined
with a significant benefit from foreign exchange rate movements, offset in part by the impact of the creation of a joint venture in June 2009 between
Vodafone Australia and Hutchison 3G Australia. On an organic basis service revenue increased by 7.5%(*) reflecting a 51% increase in the mobile customer
base and continued strong data revenue growth partially offset by a decline in mobile voice pricing. India contributed around 64% of the region’s organic
service revenue growth.