Vodafone 2011 Annual Report Download - page 107
Download and view the complete annual report
Please find page 107 of the 2011 Vodafone annual report below. You can navigate through the pages in the report by either clicking on the pages listed below, or by using the keyword search tool below to find specific information within the annual report.-
 1
1 -
2
-
3
-
4
-
5
-
6
-
7
-
8
-
9
-
10
-
11
-
12
-
13
-
14
-
15
-
16
-
17
-
18
-
19
-
20
-
21
-
22
-
23
-
24
-
25
-
26
-
27
-
28
-
29
-
30
-
31
-
32
-
33
-
34
-
35
-
36
-
37
-
38
-
39
-
40
-
41
-
42
-
43
-
44
-
45
-
46
-
47
-
48
-
49
-
50
-
51
-
52
-
53
-
54
-
55
-
56
-
57
-
58
-
59
-
60
-
61
-
62
-
63
-
64
-
65
-
66
-
67
-
68
-
69
-
70
-
71
-
72
-
73
-
74
-
75
-
76
-
77
-
78
-
79
-
80
-
81
-
82
-
83
-
84
-
85
-
86
-
87
-
88
-
89
-
90
-
91
-
92
-
93
-
94
-
95
-
96
-
 97
97 -
 98
98 -
 99
99 -
 100
100 -
 101
101 -
 102
102 -
 103
103 -
 104
104 -
 105
105 -
 106
106 -
 107
107 -
 108
108 -
 109
109 -
 110
110 -
 111
111 -
 112
112 -
 113
113 -
 114
114 -
 115
115 -
 116
116 -
 117
117 -
118
-
119
-
120
-
121
-
122
-
123
-
124
-
125
-
126
-
127
-
128
-
129
-
130
-
131
-
132
-
133
-
134
-
135
-
136
-
137
-
138
-
139
-
140
-
141
-
142
-
143
-
144
-
145
-
146
-
147
-
148
-
149
-
150
-
151
-
152
-
153
-
154
-
155
-
156
 |
 |

Vodafone Group Plc Annual Report 2011 105
Financials
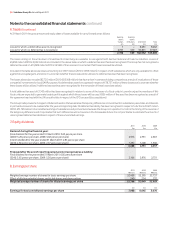
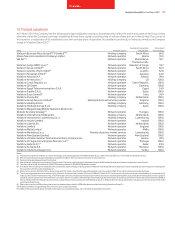
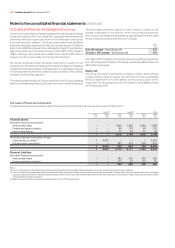
14. Investments in associates
At 31 March 2011 the Company had the following principal associates carrying on businesses which affect the profits and assets of the Group. The
Company’s principal associates all have share capital consisting solely of ordinary shares, unless otherwise stated, and are all indirectly held. The country
of incorporation or registration of all associates is also their principal place of operation.
Country of incorporation Percentage(1)
Name Principal activity or registration shareholdings
Cellco Partnership(2) Network operator US 45.0
Société Française du Radiotéléphone S.A. (‘SFR’)(3) Network operator France 44.0
Safaricom Limited(4)(5) Network operator Kenya 40.0
Notes:
(1) Rounded to nearest tenth of one percent.
(2) Cellco Partnership trades under the name Verizon Wireless.
(3) On 3 April 2011 the Group announced an agreement to sell its entire 44% interest in SFR. See note 32 for further information.
(4) The Group also holds two non-voting shares.
(5) At 31 March 2011 the fair value of Safaricom Limited was KES 61 billion (£456 million) based on the closing quoted share price on the Nairobi Stock Exchange.
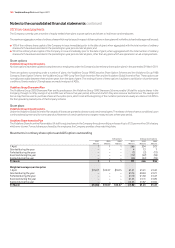
The Group’s share of the aggregated financial information of equity accounted associates is set out below. The amounts for the year ended 31 March 2009
include the share of results in Safaricom from 28 May 2008, at which time its consolidation status changed from being a joint venture to an associate.
2011 2010 2009
£m £m £m
Share of revenue in associates 24,213 23,288 19,307
Share of result in associates 5,059 4,742 4,091
Share of discontinued operations in associates 18 93 57
2011 2010
£m £m
Non-current assets 45,446 47,048
Current assets 5,588 4,901
Share of total assets 51,034 51,949
Non-current liabilities 5,719 8,295
Current liabilities 6,656 6,685
Non-controlling interests 554 592
Share of total liabilities and non-controlling interests 12,929 15,572
Share of equity shareholders’ funds in associates 38,105 36,377
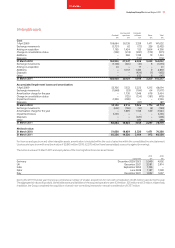
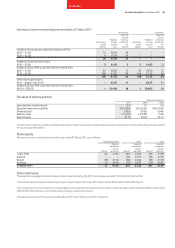
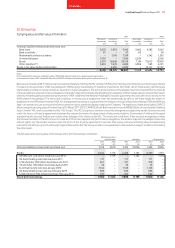
15. Other investments
Non-current other investments comprise the following, all of which are classified as available-for-sale, with the exception of other debt and bonds, which
are classified as loans and receivables, and cash held in restricted deposits:
2011 2010
£m £m
Included within non-current assets:
Listed securities:
Equity securities 1 4,072
Unlisted securities:
Equity securities 967 879
Public debt and bonds 3 11
Other debt and bonds 72 2,355
Cash held in restricted deposits 338 274
1,381 7,591
Included within current assets:
Government bonds 610 388
Other 64 –
674 388
At 31 March 2010 listed equity securities included £4,071 million in relation to the Group’s 3.2% interest in China Mobile Limited which was sold in
September 2010 for £4,264 million generating a £3,019 million income statement gain, including income statement recognition of foreign exchange rate
gains previously recognised in equity.
Unlisted equity securities include a 26% interest in Bharti Infotel Private Limited through which the Group has a 4.37% economic interest in Bharti Airtel
Limited. Unlisted equity investments are recorded at fair value where appropriate, or at cost if their fair value cannot be reliably measured as there is no
active market upon which they are traded.
For public debt and bonds and cash held in restricted deposits, the carrying amount approximates fair value.
The short-term investments primarily consist of index linked gilts with less than six years to maturity, which can be readily converted into cash via the gilt
repurchase market and are held on an effective floating rate basis.