Vodafone 2011 Annual Report Download - page 115
Download and view the complete annual report
Please find page 115 of the 2011 Vodafone annual report below. You can navigate through the pages in the report by either clicking on the pages listed below, or by using the keyword search tool below to find specific information within the annual report.-
 1
1 -
2
-
3
-
4
-
5
-
6
-
7
-
8
-
9
-
10
-
11
-
12
-
13
-
14
-
15
-
16
-
17
-
18
-
19
-
20
-
21
-
22
-
23
-
24
-
25
-
26
-
27
-
28
-
29
-
30
-
31
-
32
-
33
-
34
-
35
-
36
-
37
-
38
-
39
-
40
-
41
-
42
-
43
-
44
-
45
-
46
-
47
-
48
-
49
-
50
-
51
-
52
-
53
-
54
-
55
-
56
-
57
-
58
-
59
-
60
-
61
-
62
-
63
-
64
-
65
-
66
-
67
-
68
-
69
-
70
-
71
-
72
-
73
-
74
-
75
-
76
-
77
-
78
-
79
-
80
-
81
-
82
-
83
-
84
-
85
-
86
-
87
-
88
-
89
-
90
-
91
-
92
-
93
-
94
-
95
-
96
-
97
-
98
-
99
-
100
-
101
-
102
-
103
-
104
-
 105
105 -
 106
106 -
 107
107 -
 108
108 -
 109
109 -
 110
110 -
 111
111 -
 112
112 -
 113
113 -
 114
114 -
 115
115 -
 116
116 -
 117
117 -
 118
118 -
 119
119 -
 120
120 -
 121
121 -
 122
122 -
 123
123 -
 124
124 -
 125
125 -
126
-
127
-
128
-
129
-
130
-
131
-
132
-
133
-
134
-
135
-
136
-
137
-
138
-
139
-
140
-
141
-
142
-
143
-
144
-
145
-
146
-
147
-
148
-
149
-
150
-
151
-
152
-
153
-
154
-
155
-
156
 |
 |

Vodafone Group Plc Annual Report 2011 113
Financials
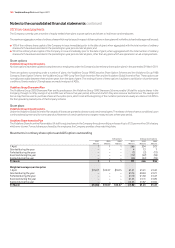
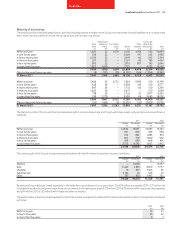
22. Borrowings
Carrying value and fair value information 2011 2010
Short-term Long-term Short-term Long-term
borrowings borrowings Total borrowings borrowings Total
£m £m £m £m £m £m
Financial liabilities measured at amortised cost:
Bank loans 2,070 5,872 7,942 3,460 4,183 7,643
Bank overdrafts 47 – 47 60 – 60
Redeemable preference shares – 1,169 1,169 – 1,242 1,242
Commercial paper 1,660 – 1,660 2,563 – 2,563
Bonds 2,470 16,046 18,516 1,174 12,675 13,849
Other liabilities(1)(2) 3,659 1,023 4,682 3,906 385 4,291
Bonds in fair value hedge relationships – 4,265 4,265 – 10,147 10,147
9,906 28,375 38,281 11,163 28,632 39,795
Notes:
(1) At 31 March 2011 amount includes £531 million (2010: £604 million) in relation to collateral support agreements.
(2) Amounts at 31 March 2011 includes £3,190 million (2010: £3,405 million) in relation to the options disclosed in note 12.
Banks loans include a ZAR 3.5 billion loan borrowed by Vodafone Holdings SA Pty Limited (‘VHSA’), which directly and indirectly owns the Group’s interest
in Vodacom Group Limited. VHSA has pledged its 100% equity shareholding in Vodafone Investments SA (‘VISA’), which holds a direct 20.1% equity
shareholding in Vodacom Group Limited, as security for its loan obligations. The terms and conditions of the pledge mean that should VHSA not meet all
of its loan payment and performance obligations, the lenders may sell the equity shareholding in its subsidiary VISA at market value to recover their losses,
with any remaining sales proceeds being returned to VHSA. Vodafone International Holdings B.V. has also guaranteed this loan with recourse only to the
VHSA shares it has pledged. The terms and conditions of the security arrangement mean the lenders may be able to sell these respective shares in
preference to the VISA shares held by VHSA. An arrangement has been put in place where the Vodacom Group Limited shares held by VHSA and VISA are
held in an escrow account to ensure the shares cannot be sold to satisfy the pledge made by the Company. The maximum collateral provided is ZAR 3.5
billion, being the carrying value of the bank loan at 31 March 2011 (2010: ZAR 4.85 billion). Bank loans also include INR 262 billion of loans held by Vodafone
Essar Limited (‘VEL’) and its subsidiaries (the ‘VEL Group’). The VEL Group has a number of security arrangements supporting certain licences secured
under the terms of tri-party agreements between the relevant borrower, the department of telecommunications, Government of India and the agent
representing the secured lenders and certain share pledges of the shares under VEL. The terms and conditions of the security arrangements mean
that should members of the VEL Group not meet all of their loan payment and performance obligations, the lenders may sell the pledged shares and
enforce rights over the certain licences under the terms of the tri-party agreements to recover their losses, with any remaining sales proceeds being
returned to the VEL Group. Each of the eight legal entities within the VEL Group provide cross guarantees to the lenders in respect to debt contracted by
the other seven.
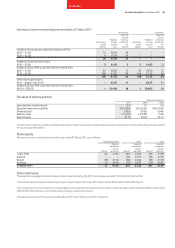
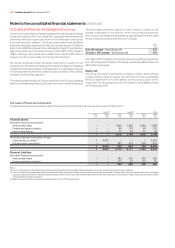
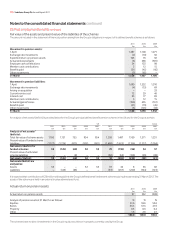
The fair value and carrying value of the Group’s short-term borrowings is as follows:
Sterling equivalent
nominal value Fair value Carrying value
2011 2010 2011 2010 2011 2010
£m £m £m £m £m £m
Financial liabilities measured at amortised cost 7,316 9,910 7,425 10,006 7,436 9,989
Bonds: 2,444 1,113 2,463 1,124 2,470 1,174
5.875% euro 1.25 billion bond due June 2010 – 1,113 – 1,124 – 1,174
US dollar floating rate note due June 2011 171 – 171 – 171 –
5.5% US dollar 750 million bond due June 2011 467 – 471 – 478 –
1% US dollar 100 million bond due August 2011 45 – 45 – 45 –
Euro floating rate note due January 2012 1,144 – 1,146 – 1,148 –
US dollar floating rate note due February 2012 306 – 306 – 306 –
5.35% US dollar 500 million bond due February 2012 311 – 324 – 322 –
Short-term borrowings 9,760 11,023 9,888 11,130 9,906 11,163