US Cellular 2008 Annual Report Download - page 83
Download and view the complete annual report
Please find page 83 of the 2008 US Cellular annual report below. You can navigate through the pages in the report by either clicking on the pages listed below, or by using the keyword search tool below to find specific information within the annual report.-
 1
1 -
2
-
3
-
4
-
5
-
6
-
7
-
8
-
9
-
10
-
11
-
12
-
13
-
14
-
15
-
16
-
17
-
18
-
19
-
20
-
21
-
22
-
23
-
24
-
25
-
26
-
27
-
28
-
29
-
30
-
31
-
32
-
33
-
34
-
35
-
36
-
37
-
38
-
39
-
40
-
41
-
42
-
43
-
44
-
45
-
46
-
47
-
48
-
49
-
50
-
51
-
52
-
53
-
54
-
55
-
56
-
57
-
58
-
59
-
60
-
61
-
62
-
63
-
64
-
65
-
66
-
67
-
68
-
69
-
70
-
71
-
72
-
 73
73 -
 74
74 -
 75
75 -
 76
76 -
 77
77 -
 78
78 -
 79
79 -
 80
80 -
 81
81 -
 82
82 -
 83
83 -
 84
84 -
 85
85 -
 86
86 -
 87
87 -
 88
88 -
 89
89 -
 90
90 -
 91
91 -
 92
92 -
 93
93 -
94
-
95
-
96
-
97
-
98
-
99
-
100
-
101
-
102
-
103
-
104
-
105
-
106
-
107
-
108
-
109
-
110
-
111
-
112
-
113
-
114
-
115
-
116
-
117
-
118
-
119
-
120
-
121
-
122
-
123
-
124
-
125
-
126
-
127
-
128
-
129
-
130
-
131
-
132
-
133
-
134
-
135
-
136
-
137
-
138
-
139
-
140
-
141
-
142
-
143
-
144
-
145
-
146
-
147
-
148
-
149
-
150
-
151
-
152
-
153
-
154
-
155
-
156
-
157
-
158
-
159
-
160
-
161
-
162
-
163
-
164
-
165
-
166
-
167
-
168
-
169
-
170
-
171
-
172
-
173
-
174
-
175
-
176
-
177
-
178
-
179
-
180
-
181
-
182
-
183
-
184
-
185
-
186
-
187
-
188
-
189
-
190
-
191
-
192
-
193
-
194
-
195
-
196
-
197
-
198
-
199
-
200
-
201
-
202
-
203
-
204
-
205
-
206
-
207
 |
 |

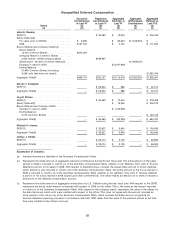
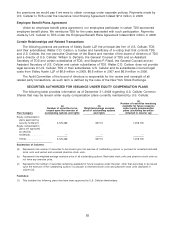
exceeded the closing price of the USM shares on December 31, 2008 of $43.24 per share, no dollar
potential amount due upon acceleration is reflected in the table.
Number of Shares
Underlying Specified
Awards that are Value at 12/31/08
Option (Per Share Exercise Price Unvested at based on $43.24 Less Aggregate Difference
of Options) 12/31/08 per share Exercise Price (if Positive)
Steven T. Campbell(2)
2008 Options ($57.19) ........ 27,175 $1,175,047 $1,554,138 $ —
2007 Options ($73.84) ........ 12,900 $ 557,796 $ 952,536 $ —
2006 Options ($59.43) ........ 3,788 $ 163,793 $ 225,121 $ —
2005 Options ($47.76) ........ 1,282 $ 55,434 $ 61,228 $ —
Total ................... 45,145 $ —
Jay M. Ellison
2008 Options ($57.19) ........ 61,250 $2,648,450 $3,502,889 $ —
2007 Options ($73.84) ........ 30,075 $1,300,443 $2,220,738 $ —
2006 Options ($59.43) ........ 18,638 $ 805,907 $1,107,656 $ —
2005 Options ($45.63) ........ 8,600 $ 371,864 $ 392,418 $ —
Total ................... 118,563 $ —
Michael S. Irizarry
2008 Options ($57.19) ........ 44,150 $1,909,046 $2,524,939 $ —
2007 Options ($73.84) ........ 21,619 $ 934,806 $1,596,347 $ —
2006 Options ($59.43) ........ 11,825 $ 511,313 $ 702,760 $ —
2005 Options ($45.63) ........ 5,444 $ 235,399 $ 248,410 $ —
Total ................... 83,038 $ —
Jeffrey J. Childs
2008 Options ($57.19) ........ 26,225 $1,133,969 $1,499,808 $ —
2007 Options ($73.84) ........ 12,900 $ 557,796 $ 952,536 $ —
2006 Options ($59.43) ........ 10,450 $ 451,858 $ 621,044 $ —
2005 Options ($45.63) ........ 4,813 $ 208,114 $ 219,617 $ —
Total ................... 54,388 $ —
(3) See the ‘‘Outstanding Equity Awards at Fiscal Year-End’’ table for detail of Restricted Stock Units.
76