US Cellular 2008 Annual Report Download - page 43
Download and view the complete annual report
Please find page 43 of the 2008 US Cellular annual report below. You can navigate through the pages in the report by either clicking on the pages listed below, or by using the keyword search tool below to find specific information within the annual report.-
 1
1 -
2
-
3
-
4
-
5
-
6
-
7
-
8
-
9
-
10
-
11
-
12
-
13
-
14
-
15
-
16
-
17
-
18
-
19
-
20
-
21
-
22
-
23
-
24
-
25
-
26
-
27
-
28
-
29
-
30
-
31
-
32
-
 33
33 -
 34
34 -
 35
35 -
 36
36 -
 37
37 -
 38
38 -
 39
39 -
 40
40 -
 41
41 -
 42
42 -
 43
43 -
 44
44 -
 45
45 -
 46
46 -
 47
47 -
 48
48 -
 49
49 -
 50
50 -
 51
51 -
 52
52 -
 53
53 -
54
-
55
-
56
-
57
-
58
-
59
-
60
-
61
-
62
-
63
-
64
-
65
-
66
-
67
-
68
-
69
-
70
-
71
-
72
-
73
-
74
-
75
-
76
-
77
-
78
-
79
-
80
-
81
-
82
-
83
-
84
-
85
-
86
-
87
-
88
-
89
-
90
-
91
-
92
-
93
-
94
-
95
-
96
-
97
-
98
-
99
-
100
-
101
-
102
-
103
-
104
-
105
-
106
-
107
-
108
-
109
-
110
-
111
-
112
-
113
-
114
-
115
-
116
-
117
-
118
-
119
-
120
-
121
-
122
-
123
-
124
-
125
-
126
-
127
-
128
-
129
-
130
-
131
-
132
-
133
-
134
-
135
-
136
-
137
-
138
-
139
-
140
-
141
-
142
-
143
-
144
-
145
-
146
-
147
-
148
-
149
-
150
-
151
-
152
-
153
-
154
-
155
-
156
-
157
-
158
-
159
-
160
-
161
-
162
-
163
-
164
-
165
-
166
-
167
-
168
-
169
-
170
-
171
-
172
-
173
-
174
-
175
-
176
-
177
-
178
-
179
-
180
-
181
-
182
-
183
-
184
-
185
-
186
-
187
-
188
-
189
-
190
-
191
-
192
-
193
-
194
-
195
-
196
-
197
-
198
-
199
-
200
-
201
-
202
-
203
-
204
-
205
-
206
-
207
 |
 |

Telecommunications Index was composed of the following companies: AT&T Inc., CenturyTel Inc.,
Cincinnati Bell Inc., Citizens Communications Co. (Series B), Embarq Corp., IDT Corp. (Class B), Leap
Wireless International Inc., Leucadia National Corp., Level 3 Communications Inc., MetroPCS
Communications Inc., NII Holdings Inc., Qwest Communications International Inc., RCN Corp., Sprint
Nextel Corp., Telephone and Data Systems, Inc. (TDS and TDS.S), Time Warner Telecom, Inc., U.S.
Cellular, Verizon Communications Inc., Virgin Media Inc. and Windstream Corp. As of December 31,
2008, this index also includes Frontier Communications Corp. but no longer includes Citizens
Communications Co. or IDT Corp.
Company Performance
The degree to which performance measures and objectives were achieved are discussed below
separately for those that are stated in quantitative terms and separately for those that are stated in
non-quantitative terms.
The achievement levels of objectives and performance measures that are stated in quantitative terms
and the assessment of how well U.S. Cellular did as a whole during the year includes primarily the
performance measures used in connection with the bonus plan discussed below and, potentially to a
lesser degree, other performance measures as well.
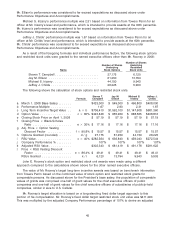
Each year, U.S. Cellular calculates an overall percentage of U.S. Cellular performance based on its
Executive Bonus Plan. The following performance measures are considered in evaluating the
achievements of the eligible participants for purposes of the Executive Bonus Plan: Consolidated Cash
Flow; Consolidated Revenue; Postpay Customer Disconnects; Return on Capital; and Customer Addition
Equivalents.
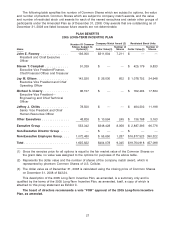
The following table shows the calculation of the overall performance percentage for 2007 based on
the 2007 Executive Bonus Plan for bonuses approved and paid in 2008. The below amounts cannot be
derived from the financial statements. The results of markets that are owned but not managed by U.S.
Cellular are not included in the below amounts. The Actual and Target results include only the results of
markets that are managed by U.S. Cellular and over which U.S. Cellular officers have influence.
Minimum
Final Achievement Prorated % Weighted
Actual Adjusted Actual as of Target (%) of Target Avg % of
Results Target a % of for Payout Bonus Target
Performance Measures for 2007 for 2007 Target (Threshold) Earned Weight Bonus
Consolidated Cash Flow
(in millions) ................. $1,067.3 $1,100.5 97.0% 90.0% 81.9% 17.5% 14.3%
Consolidated Revenue
(in millions) ................. $3,852.6 $3,725.2 103.4% 95.0% 168.39% 20.0% 33.7%
Postpay Customer Disconnects
(in thousands)* ............... 858 876 97.9% 110.0% 121.2% 20.0% 24.2%
Return on Capital Percent ....... 7.15% 7.93% 90.1% 85.0% 60.9% 25.0% 15.2%
Gross Customer Addition
Equivalents
(in thousands) ............... 1,244 1,364 91.2% 92.0% 0.00% 17.5% 0.0%
Overall Company Performance
(prorated % of target bonus) ..... 100.0% 87.5%
* Lower number is better.
As shown above, the minimum threshold was achieved for all targets for 2007 except with respect to
Gross Customer Addition Equivalents.
36