US Cellular 2008 Annual Report Download - page 124
Download and view the complete annual report
Please find page 124 of the 2008 US Cellular annual report below. You can navigate through the pages in the report by either clicking on the pages listed below, or by using the keyword search tool below to find specific information within the annual report.-
 1
1 -
2
-
3
-
4
-
5
-
6
-
7
-
8
-
9
-
10
-
11
-
12
-
13
-
14
-
15
-
16
-
17
-
18
-
19
-
20
-
21
-
22
-
23
-
24
-
25
-
26
-
27
-
28
-
29
-
30
-
31
-
32
-
33
-
34
-
35
-
36
-
37
-
38
-
39
-
40
-
41
-
42
-
43
-
44
-
45
-
46
-
47
-
48
-
49
-
50
-
51
-
52
-
53
-
54
-
55
-
56
-
57
-
58
-
59
-
60
-
61
-
62
-
63
-
64
-
65
-
66
-
67
-
68
-
69
-
70
-
71
-
72
-
73
-
74
-
75
-
76
-
77
-
78
-
79
-
80
-
81
-
82
-
83
-
84
-
85
-
86
-
87
-
88
-
89
-
90
-
91
-
92
-
93
-
94
-
95
-
96
-
97
-
98
-
99
-
100
-
101
-
102
-
103
-
104
-
105
-
106
-
107
-
108
-
109
-
110
-
111
-
112
-
113
-
 114
114 -
 115
115 -
 116
116 -
 117
117 -
 118
118 -
 119
119 -
 120
120 -
 121
121 -
 122
122 -
 123
123 -
 124
124 -
 125
125 -
 126
126 -
 127
127 -
 128
128 -
 129
129 -
 130
130 -
 131
131 -
 132
132 -
 133
133 -
 134
134 -
135
-
136
-
137
-
138
-
139
-
140
-
141
-
142
-
143
-
144
-
145
-
146
-
147
-
148
-
149
-
150
-
151
-
152
-
153
-
154
-
155
-
156
-
157
-
158
-
159
-
160
-
161
-
162
-
163
-
164
-
165
-
166
-
167
-
168
-
169
-
170
-
171
-
172
-
173
-
174
-
175
-
176
-
177
-
178
-
179
-
180
-
181
-
182
-
183
-
184
-
185
-
186
-
187
-
188
-
189
-
190
-
191
-
192
-
193
-
194
-
195
-
196
-
197
-
198
-
199
-
200
-
201
-
202
-
203
-
204
-
205
-
206
-
207
 |
 |
industry. Loss on impairment of intangible assets, net of the related income tax and minority interest,
reduced U.S. Cellular’s net income and diluted earnings per share by $236.3 million and $2.69,
respectively.
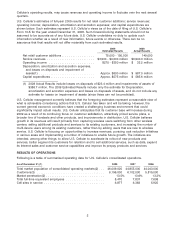
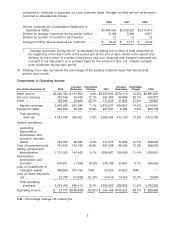
Service revenues increased $261.1 million, or 7%, to $3,940.3 million in 2008 from $3,679.2 million in
2007. U.S. Cellular experienced an increase in the number of customers, as well as an increase in
average monthly revenue per customer driven primarily by growth in revenues from data products and
services.
Operating income decreased $368.5 million, or 93%, to $27.7 million in 2008 from $396.2 million in 2007,
primarily as a result of the 2008 impairment loss related to licenses.
U.S. Cellular anticipates that future growth in its operating income will be affected by the following
factors:
• Uncertainty related to current economic conditions and their impact on demand for U.S. Cellular’s
products and services;
• Increasing penetration in the wireless industry;
• Costs of customer acquisition and retention, such as equipment subsidies and advertising;
• Industry consolidation and the resultant effects on roaming revenues, service and equipment pricing
and other effects of competition;
• Providing service in recently launched areas or potential new market areas;
• Potential increases in prepay and reseller customers as a percentage of U.S. Cellular’s customer base;
• Costs of developing and introducing new products and services;
• Costs of development and enhancement of office and customer support systems;
• Continued enhancements to its wireless networks, including potential deployments of new technology;
• Increasing costs of regulatory compliance; and
• Uncertainty in future eligible telecommunication carrier (‘‘ETC’’) funding.
Investment and other income (expense) totaled $38.4 million in 2008 and $150.3 million in 2007. The
decrease is due primarily to the settlement of variable prepaid forward contracts related to Vodafone
American Depository Receipts (‘‘ADRs’’) and disposition of the remaining ADRs in 2007. In connection
with the delivery and sale of the ADRs, U.S. Cellular recognized a pre-tax gain of $131.7 million.
Net income decreased $281.7 million to $33.0 million in 2008 compared to $314.7 million in 2007,
primarily due to an increase in Loss on impairment of intangible assets and lower Investment and other
income (expense). Basic earnings per share was $0.42 in 2008, which was $3.17 lower than in 2007 and
Diluted earnings per share was $0.42, which was $3.14 lower than in 2007.
Cash Flows and Investments
U.S. Cellular believes that cash on hand, expected future cash flows from operating activities and
sources of external financing provide financial flexibility and are sufficient to permit U.S. Cellular to
finance its contractual obligations and anticipated capital expenditures for the foreseeable future. U.S.
Cellular continues to seek to maintain a strong balance sheet and an investment grade credit rating.
See ‘‘Financial Resources’’ and ‘‘Liquidity and Capital Resources’’ below for additional information
related to cash flows and investments.
2009 Estimates
U.S. Cellular expects the factors described above to impact revenues and operating income for the next
several quarters. Any changes in the above factors, as well as the effects of other drivers of U.S.
2