US Cellular 2008 Annual Report Download - page 127
Download and view the complete annual report
Please find page 127 of the 2008 US Cellular annual report below. You can navigate through the pages in the report by either clicking on the pages listed below, or by using the keyword search tool below to find specific information within the annual report.-
 1
1 -
2
-
3
-
4
-
5
-
6
-
7
-
8
-
9
-
10
-
11
-
12
-
13
-
14
-
15
-
16
-
17
-
18
-
19
-
20
-
21
-
22
-
23
-
24
-
25
-
26
-
27
-
28
-
29
-
30
-
31
-
32
-
33
-
34
-
35
-
36
-
37
-
38
-
39
-
40
-
41
-
42
-
43
-
44
-
45
-
46
-
47
-
48
-
49
-
50
-
51
-
52
-
53
-
54
-
55
-
56
-
57
-
58
-
59
-
60
-
61
-
62
-
63
-
64
-
65
-
66
-
67
-
68
-
69
-
70
-
71
-
72
-
73
-
74
-
75
-
76
-
77
-
78
-
79
-
80
-
81
-
82
-
83
-
84
-
85
-
86
-
87
-
88
-
89
-
90
-
91
-
92
-
93
-
94
-
95
-
96
-
97
-
98
-
99
-
100
-
101
-
102
-
103
-
104
-
105
-
106
-
107
-
108
-
109
-
110
-
111
-
112
-
113
-
114
-
115
-
116
-
 117
117 -
 118
118 -
 119
119 -
 120
120 -
 121
121 -
 122
122 -
 123
123 -
 124
124 -
 125
125 -
 126
126 -
 127
127 -
 128
128 -
 129
129 -
 130
130 -
 131
131 -
 132
132 -
 133
133 -
 134
134 -
 135
135 -
 136
136 -
 137
137 -
138
-
139
-
140
-
141
-
142
-
143
-
144
-
145
-
146
-
147
-
148
-
149
-
150
-
151
-
152
-
153
-
154
-
155
-
156
-
157
-
158
-
159
-
160
-
161
-
162
-
163
-
164
-
165
-
166
-
167
-
168
-
169
-
170
-
171
-
172
-
173
-
174
-
175
-
176
-
177
-
178
-
179
-
180
-
181
-
182
-
183
-
184
-
185
-
186
-
187
-
188
-
189
-
190
-
191
-
192
-
193
-
194
-
195
-
196
-
197
-
198
-
199
-
200
-
201
-
202
-
203
-
204
-
205
-
206
-
207
 |
 |

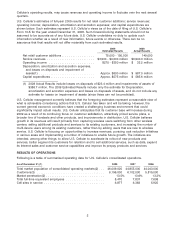
compared to variances in expenses on a per customer basis. Average monthly service revenue per
customer is calculated as follows:
2008 2007 2006
Service revenues per Consolidated Statement of
Operations (000s) .......................... $3,940,326 $3,679,237 $3,214,410
Divided by average customers during period (000s)* . . 6,169 5,992 5,671
Divided by number of months in each period ........ 12 12 12
Average monthly service revenue per customer ...... $ 53.23 $ 51.17 $ 47.23
* ‘‘Average customers during period’’ is calculated by adding the number of total customers at
the beginning of the first month of the period and at the end of each month in the period and
dividing by the number of months in the period plus one. Acquired and divested customers are
included in the calculation on a prorated basis for the amount of time U.S. Cellular included
such customers during each period.
(7) Postpay churn rate represents the percentage of the postpay customer base that disconnects
service each month.
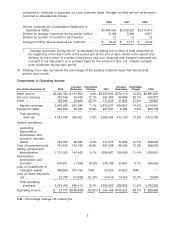
Components of Operating Income
Increase/ Percentage Increase/ Percentage
Year Ended December 31, 2008 (Decrease) Change 2007 (Decrease) Change 2006
Retail service ......... $3,445,762 $ 191,800 5.9% $3,253,962 $372,116 12.9% $2,881,846
Inbound roaming ...... 329,196 35,430 12.1% 293,766 60,889 26.1% 232,877
Other ............... 165,368 33,859 25.7% 131,509 31,822 31.9% 99,687
Service revenues ..... 3,940,326 261,089 7.1% 3,679,237 464,827 14.5% 3,214,410
Equipment sales ....... 302,859 35,832 13.4% 267,027 8,282 3.2% 258,745
Total operating
revenues ......... 4,243,185 296,921 7.5% 3,946,264 473,109 13.6% 3,473,155
System operations
(excluding
Depreciation,
amortization and
accretion reported
below) ............ 784,057 66,982 9.3% 717,075 77,392 12.1% 639,683
Cost of equipment sold . . 743,406 106,108 16.6% 637,298 68,395 12.0% 568,903
Selling, general and
administrative ....... 1,701,050 142,483 9.1% 1,558,567 159,006 11.4% 1,399,561
Depreciation,
amortization and
accretion .......... 576,931 (1,255) (0.2)% 578,186 22,661 4.1% 555,525
Loss on impairment of
intangible assets ..... 386,653 361,730 N/M 24,923 24,923 N/M —
Loss on asset disposals,
net............... 23,378 (10,638) (31.3)% 34,016 14,429 73.7% 19,587
Total operating
expenses ......... 4,215,475 665,410 18.7% 3,550,065 366,806 11.5% 3,183,259
Operating income ...... $ 27,710 $(368,489) (93.0)% $ 396,199 $106,303 36.7% $ 289,896
N/M—Percentage change not meaningful
5