US Cellular 2008 Annual Report Download - page 125
Download and view the complete annual report
Please find page 125 of the 2008 US Cellular annual report below. You can navigate through the pages in the report by either clicking on the pages listed below, or by using the keyword search tool below to find specific information within the annual report.-
 1
1 -
2
-
3
-
4
-
5
-
6
-
7
-
8
-
9
-
10
-
11
-
12
-
13
-
14
-
15
-
16
-
17
-
18
-
19
-
20
-
21
-
22
-
23
-
24
-
25
-
26
-
27
-
28
-
29
-
30
-
31
-
32
-
33
-
34
-
35
-
36
-
37
-
38
-
39
-
40
-
41
-
42
-
43
-
44
-
45
-
46
-
47
-
48
-
49
-
50
-
51
-
52
-
53
-
54
-
55
-
56
-
57
-
58
-
59
-
60
-
61
-
62
-
63
-
64
-
65
-
66
-
67
-
68
-
69
-
70
-
71
-
72
-
73
-
74
-
75
-
76
-
77
-
78
-
79
-
80
-
81
-
82
-
83
-
84
-
85
-
86
-
87
-
88
-
89
-
90
-
91
-
92
-
93
-
94
-
95
-
96
-
97
-
98
-
99
-
100
-
101
-
102
-
103
-
104
-
105
-
106
-
107
-
108
-
109
-
110
-
111
-
112
-
113
-
114
-
 115
115 -
 116
116 -
 117
117 -
 118
118 -
 119
119 -
 120
120 -
 121
121 -
 122
122 -
 123
123 -
 124
124 -
 125
125 -
 126
126 -
 127
127 -
 128
128 -
 129
129 -
 130
130 -
 131
131 -
 132
132 -
 133
133 -
 134
134 -
 135
135 -
136
-
137
-
138
-
139
-
140
-
141
-
142
-
143
-
144
-
145
-
146
-
147
-
148
-
149
-
150
-
151
-
152
-
153
-
154
-
155
-
156
-
157
-
158
-
159
-
160
-
161
-
162
-
163
-
164
-
165
-
166
-
167
-
168
-
169
-
170
-
171
-
172
-
173
-
174
-
175
-
176
-
177
-
178
-
179
-
180
-
181
-
182
-
183
-
184
-
185
-
186
-
187
-
188
-
189
-
190
-
191
-
192
-
193
-
194
-
195
-
196
-
197
-
198
-
199
-
200
-
201
-
202
-
203
-
204
-
205
-
206
-
207
 |
 |

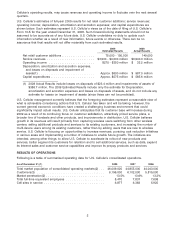
Cellular’s operating results, may cause revenues and operating income to fluctuate over the next several
quarters.
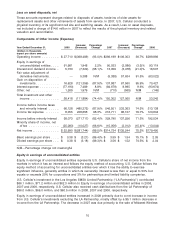
U.S. Cellular’s estimates of full-year 2009 results for net retail customer additions; service revenues;
operating income; depreciation, amortization and accretion expenses; and capital expenditures are
shown below. Such estimates represent U.S. Cellular’s views as of the date of filing of U.S. Cellular’s
Form 10-K for the year ended December 31, 2008. Such forward-looking statements should not be
assumed to be accurate as of any future date. U.S. Cellular undertakes no duty to update such
information whether as a result of new information, future events or otherwise. There can be no
assurance that final results will not differ materially from such estimated results.
2009 2008
Estimated Results Actual Results
Net retail customer additions .................. 75,000 - 150,000 149,000
Service revenues .......................... $3,900 - $4,000 million $3,940.3 million
Operating income ......................... $275 - $350 million $ 33.2 million
Depreciation, amortization and accretion expenses,
and losses on disposals and impairment of
assets(1) .............................. Approx. $600 million $ 987.0 million
Capital expenditures ........................ Approx. $575 million $ 585.6 million
(1) 2008 Actual Results include losses on disposals of $23.4 million and impairments of assets of
$386.7 million. The 2009 Estimated Results include only the estimate for Depreciation,
amortization and accretion expenses and losses on disposals of assets, and do not include any
estimate for losses on impairment of assets (since these can not be predicted).
U.S. Cellular management currently believes that the foregoing estimates represent a reasonable view of
what is achievable considering actions that U.S. Cellular has taken and will be taking. However, the
current general economic conditions have created a challenging business environment that could
significantly impact actual results. U.S. Cellular anticipates that its customer base will increase during
2009 as a result of its continuing focus on customer satisfaction, attractively priced service plans, a
broader line of handsets and other products, and improvements in distribution. U.S. Cellular believes
growth in its revenues will result primarily from capturing wireless users switching from other wireless
carriers, selling additional products and services to its existing customers, and increasing the number of
multi-device users among its existing customers, rather than by adding users that are new to wireless
service. U.S. Cellular is focusing on opportunities to increase revenues, pursuing cost reduction initiatives
in various areas and implementing a number of initiatives to enable future growth. The initiatives are
intended, among other things, to allow U.S. Cellular to accelerate its rollout of new products and
services, better segment its customers for retention and to sell additional services, such as data, expand
its Internet sales and customer service capabilities and improve its prepay products and services.
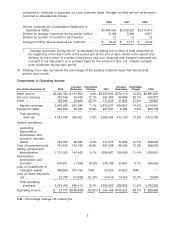
RESULTS OF OPERATIONS
Following is a table of summarized operating data for U.S. Cellular’s consolidated operations.
As of December 31,(1) 2008 2007 2006
Total market population of consolidated operating markets(2) . . . 46,009,000 44,955,000 44,043,000
Customers(3) ..................................... 6,196,000 6,102,000 5,815,000
Market penetration(2) ................................ 13.5% 13.6% 13.2%
Total full-time equivalent employees ..................... 8,470 7,837 7,608
Cell sites in service ................................. 6,877 6,383 5,925
3