US Cellular 2008 Annual Report Download - page 54
Download and view the complete annual report
Please find page 54 of the 2008 US Cellular annual report below. You can navigate through the pages in the report by either clicking on the pages listed below, or by using the keyword search tool below to find specific information within the annual report.-
 1
1 -
2
-
3
-
4
-
5
-
6
-
7
-
8
-
9
-
10
-
11
-
12
-
13
-
14
-
15
-
16
-
17
-
18
-
19
-
20
-
21
-
22
-
23
-
24
-
25
-
26
-
27
-
28
-
29
-
30
-
31
-
32
-
33
-
34
-
35
-
36
-
37
-
38
-
39
-
40
-
41
-
42
-
43
-
 44
44 -
 45
45 -
 46
46 -
 47
47 -
 48
48 -
 49
49 -
 50
50 -
 51
51 -
 52
52 -
 53
53 -
 54
54 -
 55
55 -
 56
56 -
 57
57 -
 58
58 -
 59
59 -
 60
60 -
 61
61 -
 62
62 -
 63
63 -
 64
64 -
65
-
66
-
67
-
68
-
69
-
70
-
71
-
72
-
73
-
74
-
75
-
76
-
77
-
78
-
79
-
80
-
81
-
82
-
83
-
84
-
85
-
86
-
87
-
88
-
89
-
90
-
91
-
92
-
93
-
94
-
95
-
96
-
97
-
98
-
99
-
100
-
101
-
102
-
103
-
104
-
105
-
106
-
107
-
108
-
109
-
110
-
111
-
112
-
113
-
114
-
115
-
116
-
117
-
118
-
119
-
120
-
121
-
122
-
123
-
124
-
125
-
126
-
127
-
128
-
129
-
130
-
131
-
132
-
133
-
134
-
135
-
136
-
137
-
138
-
139
-
140
-
141
-
142
-
143
-
144
-
145
-
146
-
147
-
148
-
149
-
150
-
151
-
152
-
153
-
154
-
155
-
156
-
157
-
158
-
159
-
160
-
161
-
162
-
163
-
164
-
165
-
166
-
167
-
168
-
169
-
170
-
171
-
172
-
173
-
174
-
175
-
176
-
177
-
178
-
179
-
180
-
181
-
182
-
183
-
184
-
185
-
186
-
187
-
188
-
189
-
190
-
191
-
192
-
193
-
194
-
195
-
196
-
197
-
198
-
199
-
200
-
201
-
202
-
203
-
204
-
205
-
206
-
207
 |
 |

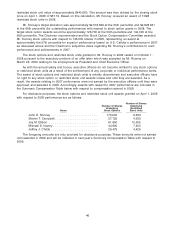
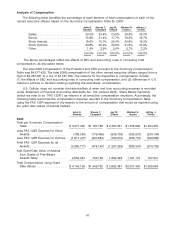
Analysis of Compensation
The following table identifies the percentage of each element of total compensation of each of the
named executive officers based on the Summary Compensation Table for 2008:
John E. Steven T. Jay M. Michael S. Jeffrey J.
Rooney Campbell Ellison Irizarry Childs
Salary ....................... 20.0% 35.4% 23.9% 28.8% 33.0%
Bonus ....................... 15.8% 21.4% 17.7% 16.2% 16.7%
Stock Awards .................. 18.0% 15.0% 22.4% 20.8% 19.2%
Stock Options ................. 44.8% 25.3% 33.6% 31.5% 27.9%
Other ........................ 1.4% 2.9% 2.4% 2.7% 3.2%
100.0% 100.0% 100.0% 100.0% 100.0%
The above percentages reflect the effects of SEC and accounting rules in computing total
compensation, as discussed below.
The total 2008 compensation of the President and CEO pursuant to the Summary Compensation
Table was $4,277,435. The total 2008 compensation of the other named executive officers ranged from a
high of $2,267,361 to a low of $1,187,786. The reasons for the disparities in compensation include:
(1) the effects of SEC and accounting rules in computing total compensation, and (2) differences in U.S.
Cellular’s policies or decision-making regarding the executives’ compensation.
U.S. Cellular does not consider the technicalities of when and how accounting expense is recorded
under Statement of Financial Accounting Standards No. 123 (revised 2004), Share Based Payments
(which we refer to as ‘‘FAS 123R’’) as relevant in its executive compensation decisions. Accordingly, the
following table reconciles the compensation expense reported in the Summary Compensation Table
using the FAS 123R expense of the awards to the amount of compensation that would be reported using
the grant date values of awards instead:
John E. Steven T. Jay M. Michael S. Jeffrey J.
Rooney Campbell Ellison Irizarry Childs
2008
Total per Summary Compensation
Table ..................... $4,277,435 $1,187,786 $ 2,267,361 $1,705,692 $1,224,352
Less FAS 123R Expense for Stock
Awards .................... (768,240) (176,456) (506,709) (353,637) (234,144)
Less FAS 123R Expense for Options (1,917,477) (297,684) (760,619) (535,710) (340,585)
Total FAS 123R Expense for all
Awards .................... (2,685,717) (474,140) (1,267,328) (889,347) (574,729)
Add Grant Date Value of Awards
from Grants of Plan-Based
Awards Table ............... 2,554,451 733,146 1,652,448 1,191,115 707,341
Total Compensation using Grant
Date Values ................ $4,146,169 $1,446,792 $ 2,652,481 $2,007,460 $1,356,964
47