US Cellular 2008 Annual Report Download - page 154
Download and view the complete annual report
Please find page 154 of the 2008 US Cellular annual report below. You can navigate through the pages in the report by either clicking on the pages listed below, or by using the keyword search tool below to find specific information within the annual report.-
 1
1 -
2
-
3
-
4
-
5
-
6
-
7
-
8
-
9
-
10
-
11
-
12
-
13
-
14
-
15
-
16
-
17
-
18
-
19
-
20
-
21
-
22
-
23
-
24
-
25
-
26
-
27
-
28
-
29
-
30
-
31
-
32
-
33
-
34
-
35
-
36
-
37
-
38
-
39
-
40
-
41
-
42
-
43
-
44
-
45
-
46
-
47
-
48
-
49
-
50
-
51
-
52
-
53
-
54
-
55
-
56
-
57
-
58
-
59
-
60
-
61
-
62
-
63
-
64
-
65
-
66
-
67
-
68
-
69
-
70
-
71
-
72
-
73
-
74
-
75
-
76
-
77
-
78
-
79
-
80
-
81
-
82
-
83
-
84
-
85
-
86
-
87
-
88
-
89
-
90
-
91
-
92
-
93
-
94
-
95
-
96
-
97
-
98
-
99
-
100
-
101
-
102
-
103
-
104
-
105
-
106
-
107
-
108
-
109
-
110
-
111
-
112
-
113
-
114
-
115
-
116
-
117
-
118
-
119
-
120
-
121
-
122
-
123
-
124
-
125
-
126
-
127
-
128
-
129
-
130
-
131
-
132
-
133
-
134
-
135
-
136
-
137
-
138
-
139
-
140
-
141
-
142
-
143
-
 144
144 -
 145
145 -
 146
146 -
 147
147 -
 148
148 -
 149
149 -
 150
150 -
 151
151 -
 152
152 -
 153
153 -
 154
154 -
 155
155 -
 156
156 -
 157
157 -
 158
158 -
 159
159 -
 160
160 -
 161
161 -
 162
162 -
 163
163 -
 164
164 -
165
-
166
-
167
-
168
-
169
-
170
-
171
-
172
-
173
-
174
-
175
-
176
-
177
-
178
-
179
-
180
-
181
-
182
-
183
-
184
-
185
-
186
-
187
-
188
-
189
-
190
-
191
-
192
-
193
-
194
-
195
-
196
-
197
-
198
-
199
-
200
-
201
-
202
-
203
-
204
-
205
-
206
-
207
 |
 |

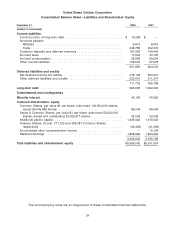
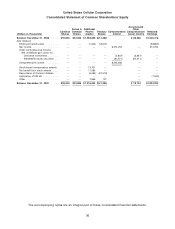
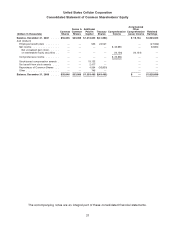
United States Cellular Corporation
Consolidated Statement of Cash Flows
Year Ended December 31, 2008 2007 2006
(Dollars in thousands)
Cash flows from operating activities
Net income ............................................. $ 32,990 $ 314,734 $ 179,490
Add (deduct) adjustments to reconcile net income to net cash flows from
operating activities
Depreciation, amortization and accretion ....................... 576,931 578,186 555,525
Bad debts expense ...................................... 73,157 66,923 62,030
Stock-based compensation expense .......................... 15,122 14,681 20,053
Deferred income taxes, net ................................. (83,121) (26,503) (32,946)
Equity in earnings of unconsolidated entities ..................... (91,981) (90,033) (93,119)
Distributions from unconsolidated entities ....................... 91,845 86,873 77,835
Minority share of income .................................. 25,083 15,056 13,044
Unrealized fair value adjustment of derivative instruments ............ — 5,388 63,022
Gain on disposition of investments ........................... (16,628) (137,987) (70,427)
Loss in impairment of intangible assets ........................ 386,653 24,923 —
Loss on asset disposals, net ................................ 23,378 34,016 19,587
Noncash interest expense ................................. 1,772 1,776 1,780
Excess tax benefit from stock awards .......................... (1,151) (11,718) (2,481)
Other operating activities .................................. 210 (5,538) 244
Changes in assets and liabilities from operations
Change in accounts receivable .............................. (68,039) (98,634) (95,649)
Change in inventory ..................................... (15,563) 16,312 (24,180)
Change in accounts payable—trade .......................... (4,572) 10,969 (6,072)
Change in accounts payable—affiliate ......................... 1,093 (5,049) 6,329
Change in customer deposits and deferred revenues ............... 7,628 19,935 11,375
Change in accrued taxes .................................. (34,699) 36,051 2,213
Change in accrued interest ................................. — (1,192) 217
Change in other assets and liabilities .......................... 2,669 13,909 13,198
922,777 863,078 701,068
Cash flows from investing activities
Additions to property, plant and equipment ....................... (585,590) (565,495) (579,785)
Proceeds from disposition of investments ........................ 16,690 4,301 —
Cash received from divestitures ............................... 6,838 4,277 101,583
Cash paid for acquisitions and licenses .......................... (341,694) (21,478) (145,680)
Proceeds from return of investments ............................ 1,335 — 28,650
Other investing activities .................................... (1,606) (1,086) (957)
(904,027) (579,481) (596,189)
Cash flows from financing activities
Issuance of notes payable ................................... 100,000 25,000 415,000
Repayment of notes payable ................................. (100,000) (60,000) (515,000)
Common shares reissued, net of tax payments .................... (2,288) 10,073 15,909
Common shares repurchased ................................ (28,366) (87,902) —
Excess tax benefit from stock awards ........................... 1,151 11,718 2,481
Capital distributions to minority partners ......................... (19,676) (10,866) (19,360)
Other financing activities .................................... (3,108) 1 —
(52,287) (111,976) (100,970)
Net increase (decrease) in cash and cash equivalents ............... (33,537) 171,621 3,909
Cash and cash equivalents
Beginning of period ....................................... 204,533 32,912 29,003
End of period ........................................... $170,996 $ 204,533 $ 32,912
The accompanying notes are an integral part of these consolidated financial statements.
32