US Cellular 2008 Annual Report Download - page 130
Download and view the complete annual report
Please find page 130 of the 2008 US Cellular annual report below. You can navigate through the pages in the report by either clicking on the pages listed below, or by using the keyword search tool below to find specific information within the annual report.-
 1
1 -
2
-
3
-
4
-
5
-
6
-
7
-
8
-
9
-
10
-
11
-
12
-
13
-
14
-
15
-
16
-
17
-
18
-
19
-
20
-
21
-
22
-
23
-
24
-
25
-
26
-
27
-
28
-
29
-
30
-
31
-
32
-
33
-
34
-
35
-
36
-
37
-
38
-
39
-
40
-
41
-
42
-
43
-
44
-
45
-
46
-
47
-
48
-
49
-
50
-
51
-
52
-
53
-
54
-
55
-
56
-
57
-
58
-
59
-
60
-
61
-
62
-
63
-
64
-
65
-
66
-
67
-
68
-
69
-
70
-
71
-
72
-
73
-
74
-
75
-
76
-
77
-
78
-
79
-
80
-
81
-
82
-
83
-
84
-
85
-
86
-
87
-
88
-
89
-
90
-
91
-
92
-
93
-
94
-
95
-
96
-
97
-
98
-
99
-
100
-
101
-
102
-
103
-
104
-
105
-
106
-
107
-
108
-
109
-
110
-
111
-
112
-
113
-
114
-
115
-
116
-
117
-
118
-
119
-
 120
120 -
 121
121 -
 122
122 -
 123
123 -
 124
124 -
 125
125 -
 126
126 -
 127
127 -
 128
128 -
 129
129 -
 130
130 -
 131
131 -
 132
132 -
 133
133 -
 134
134 -
 135
135 -
 136
136 -
 137
137 -
 138
138 -
 139
139 -
 140
140 -
141
-
142
-
143
-
144
-
145
-
146
-
147
-
148
-
149
-
150
-
151
-
152
-
153
-
154
-
155
-
156
-
157
-
158
-
159
-
160
-
161
-
162
-
163
-
164
-
165
-
166
-
167
-
168
-
169
-
170
-
171
-
172
-
173
-
174
-
175
-
176
-
177
-
178
-
179
-
180
-
181
-
182
-
183
-
184
-
185
-
186
-
187
-
188
-
189
-
190
-
191
-
192
-
193
-
194
-
195
-
196
-
197
-
198
-
199
-
200
-
201
-
202
-
203
-
204
-
205
-
206
-
207
 |
 |
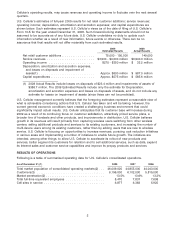
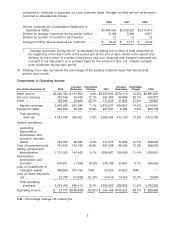
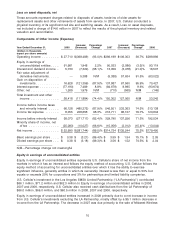
related to local interconnection to the wireline network, charges for maintenance of U.S. Cellular’s
network, long-distance charges, outbound roaming expenses and payments to third-party data product
and platform developers. Key components of the overall increases in system operations expenses were
as follows:
• Expenses incurred when U.S. Cellular’s customers used other carriers’ networks while roaming
increased $28.0 million, or 17%, in 2008 and $29.6 million, or 22%, in 2007. The increases were due to
an increase in roaming minutes of use driven by customer migration to national and wide area plans.
• Maintenance, utility and cell site expenses increased $24.6 million, or 9%, in 2008 and $27.5 million, or
11% in 2007, primarily driven by increases in the number of cell sites within U.S. Cellular’s network
and rent expense per cell site. The number of cell sites totaled 6,877 in 2008, 6,383 in 2007 and 5,925
in 2006, as U.S. Cellular continued to grow by expanding and enhancing coverage in its existing
markets and also through acquisitions of existing wireless operations. The increase in 2008 also was
due to an increase in software maintenance costs to support rapidly growing data needs.
• The cost of network usage on U.S. Cellular’s systems increased $14.4 million, or 5%, in 2008 and
$20.3 million, or 8%, in 2007, as voice and data usage on U.S. Cellular’s systems increased driven
primarily by continued migration to voice plans with a larger number of packaged minutes, text
messaging plans, and other data offerings. In addition, data network and developer costs increased
due to the increase in data usage.
U.S. Cellular expects total system operations expenses to increase in the foreseeable future, driven by
the following factors:
• Increases in the number of cell sites and other network facilities within U.S. Cellular’s systems as it
continues to add capacity and enhance quality;
• Continued expansion of EVDO services to additional markets; and
• Increases in voice minutes of use and data usage, both on U.S. Cellular’s network and by U.S.
Cellular’s customers on other carriers’ networks when roaming.
These factors are expected to be partially offset by anticipated decreases in the per-minute cost of usage
both on U.S. Cellular’s network and on other carriers’ networks.
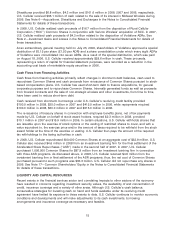
Cost of equipment sold
Cost of equipment sold increased in 2008 and 2007 primarily from increases in the average cost per
handset sold as a result of sales of more expensive handsets with expanded capabilities; such increases
were 13% and 9% in 2008 and 2007, respectively. U.S. Cellular believes that the expanded capabilities
will drive increases in data revenues.
U.S. Cellular expects loss on equipment, defined as equipment sales revenues less cost of equipment
sold, to increase in the foreseeable future as wireless carriers continue to use handset availability and
pricing as a means of competitive differentiation. New handsets with expanded capabilities, particularly
Smartphones, generally have higher purchase costs for carriers which, due to competitive market
conditions, generally cannot be recovered through proportionately higher selling prices to customers.
Selling, general and administrative expenses
Selling, general and administrative expenses include salaries, commissions and expenses of field sales
and retail personnel and facilities; telesales department salaries and expenses; agent commissions and
related expenses; corporate marketing and merchandise management; advertising; and public relations
expenses. Selling, general and administrative expenses also include bad debts expense, the costs of
operating U.S. Cellular’s customer care centers and the majority of U.S. Cellular’s corporate expenses.
The increases in Selling, general and administrative expenses in 2008 and 2007 were due primarily to
higher expenses associated with acquiring, serving and retaining customers, driven in part by an
8