US Cellular 2008 Annual Report Download - page 132
Download and view the complete annual report
Please find page 132 of the 2008 US Cellular annual report below. You can navigate through the pages in the report by either clicking on the pages listed below, or by using the keyword search tool below to find specific information within the annual report.-
 1
1 -
2
-
3
-
4
-
5
-
6
-
7
-
8
-
9
-
10
-
11
-
12
-
13
-
14
-
15
-
16
-
17
-
18
-
19
-
20
-
21
-
22
-
23
-
24
-
25
-
26
-
27
-
28
-
29
-
30
-
31
-
32
-
33
-
34
-
35
-
36
-
37
-
38
-
39
-
40
-
41
-
42
-
43
-
44
-
45
-
46
-
47
-
48
-
49
-
50
-
51
-
52
-
53
-
54
-
55
-
56
-
57
-
58
-
59
-
60
-
61
-
62
-
63
-
64
-
65
-
66
-
67
-
68
-
69
-
70
-
71
-
72
-
73
-
74
-
75
-
76
-
77
-
78
-
79
-
80
-
81
-
82
-
83
-
84
-
85
-
86
-
87
-
88
-
89
-
90
-
91
-
92
-
93
-
94
-
95
-
96
-
97
-
98
-
99
-
100
-
101
-
102
-
103
-
104
-
105
-
106
-
107
-
108
-
109
-
110
-
111
-
112
-
113
-
114
-
115
-
116
-
117
-
118
-
119
-
120
-
121
-
 122
122 -
 123
123 -
 124
124 -
 125
125 -
 126
126 -
 127
127 -
 128
128 -
 129
129 -
 130
130 -
 131
131 -
 132
132 -
 133
133 -
 134
134 -
 135
135 -
 136
136 -
 137
137 -
 138
138 -
 139
139 -
 140
140 -
 141
141 -
 142
142 -
143
-
144
-
145
-
146
-
147
-
148
-
149
-
150
-
151
-
152
-
153
-
154
-
155
-
156
-
157
-
158
-
159
-
160
-
161
-
162
-
163
-
164
-
165
-
166
-
167
-
168
-
169
-
170
-
171
-
172
-
173
-
174
-
175
-
176
-
177
-
178
-
179
-
180
-
181
-
182
-
183
-
184
-
185
-
186
-
187
-
188
-
189
-
190
-
191
-
192
-
193
-
194
-
195
-
196
-
197
-
198
-
199
-
200
-
201
-
202
-
203
-
204
-
205
-
206
-
207
 |
 |

Loss on asset disposals, net
These amounts represent charges related to disposals of assets, trade-ins of older assets for
replacement assets and other retirements of assets from service. In 2007, U.S. Cellular conducted a
physical inventory of its significant cell site and switching assets. As a result, Loss on asset disposals,
net included a charge of $14.6 million in 2007 to reflect the results of the physical inventory and related
valuation and reconciliation.
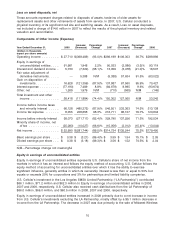
Components of Other Income (Expense)
Increase/ Percentage Increase/ Percentage
Year Ended December 31, 2008 (Decrease) Change 2007 (Decrease) Change 2006
(Dollars in thousands,
expect per share amounts)
Operating income .......... $27,710 $(368,489) (93.0)% $396,199 $106,303 36.7% $289,896
Equity in earnings of
unconsolidated entities ..... 91,981 1,948 2.2% 90,033 (3,086) (3.3)% 93,119
Interest and dividend income . . 5,730 (7,329) (56.1)% 13,059 (3,478) (21.0)% 16,537
Fair value adjustment of
derivative instruments ...... — 5,388 N/M (5,388) 57,634 91.5% (63,022)
Gain on disposition of
investments ............. 16,628 (121,359) (87.9)% 137,987 67,560 95.9% 70,427
Interest expense ........... (77,190) 7,489 8.8% (84,679) 8,995 9.6% (93,674)
Other, net ................ 1,269 1,979 N/M (710) (565) N/M (145)
Total investment and other
income ................ 38,418 (111,884) (74.4)% 150,302 127,060 N/M 23,242
Income before income taxes
and minority interest ...... 66,128 (480,373) (87.9)% 546,501 233,363 74.5% 313,138
Income tax expense ........ 8,055 208,656 96.3% 216,711 96,107 79.7% 120,604
Income before minority interest . 58,073 (271,717) (82.4)% 329,790 137,256 71.3% 192,534
Minority share of income, net
of tax ................. (25,083) (10,027) (66.6)% (15,056) (2,012) (15.4)% (13,044)
Net income ............... $32,990 $(281,744) (89.5)% $314,734 $135,244 75.3% $179,490
Basic earnings per share ..... $ 0.38 $ (3.21) (89.4)% $ 3.59 $ 1.54 75.1% $ 2.05
Diluted earnings per share .... $ 0.38 $ (3.18) (89.3)% $ 3.56 $ 1.52 74.5% $ 2.04
N/M—Percentage change not meaningful
Equity in earnings of unconsolidated entities
Equity in earnings of unconsolidated entities represents U.S. Cellular’s share of net income from the
markets in which it has an interest and follows the equity method of accounting. U.S. Cellular follows the
equity method of accounting for unconsolidated entities over which it has the ability to exercise
significant influence, generally entities in which its ownership interest is less than or equal to 50% but
equals or exceeds 20% for corporations and 3% for partnerships and limited liability companies.
U.S. Cellular’s investment in the Los Angeles SMSA Limited Partnership (‘‘LA Partnership’’) contributed
$66.1 million, $71.2 million and $62.3 million to Equity in earnings of unconsolidated entities in 2008,
2007 and 2006, respectively. U.S. Cellular also received cash distributions from the LA Partnership of
$66.0 million, $66.0 million, and $60.5 million in 2008, 2007 and 2006, respectively.
Equity in earnings of unconsolidated entities increased in 2008 primarily due to a net increase in income
from U.S. Cellular’s investments excluding the LA Partnership, mostly offset by a $5.1 million decrease in
income from the LA Partnership. The decrease in 2007 was due primarily to the sale of Midwest Wireless
10