US Cellular 2008 Annual Report Download - page 202
Download and view the complete annual report
Please find page 202 of the 2008 US Cellular annual report below. You can navigate through the pages in the report by either clicking on the pages listed below, or by using the keyword search tool below to find specific information within the annual report.-
 1
1 -
2
-
3
-
4
-
5
-
6
-
7
-
8
-
9
-
10
-
11
-
12
-
13
-
14
-
15
-
16
-
17
-
18
-
19
-
20
-
21
-
22
-
23
-
24
-
25
-
26
-
27
-
28
-
29
-
30
-
31
-
32
-
33
-
34
-
35
-
36
-
37
-
38
-
39
-
40
-
41
-
42
-
43
-
44
-
45
-
46
-
47
-
48
-
49
-
50
-
51
-
52
-
53
-
54
-
55
-
56
-
57
-
58
-
59
-
60
-
61
-
62
-
63
-
64
-
65
-
66
-
67
-
68
-
69
-
70
-
71
-
72
-
73
-
74
-
75
-
76
-
77
-
78
-
79
-
80
-
81
-
82
-
83
-
84
-
85
-
86
-
87
-
88
-
89
-
90
-
91
-
92
-
93
-
94
-
95
-
96
-
97
-
98
-
99
-
100
-
101
-
102
-
103
-
104
-
105
-
106
-
107
-
108
-
109
-
110
-
111
-
112
-
113
-
114
-
115
-
116
-
117
-
118
-
119
-
120
-
121
-
122
-
123
-
124
-
125
-
126
-
127
-
128
-
129
-
130
-
131
-
132
-
133
-
134
-
135
-
136
-
137
-
138
-
139
-
140
-
141
-
142
-
143
-
144
-
145
-
146
-
147
-
148
-
149
-
150
-
151
-
152
-
153
-
154
-
155
-
156
-
157
-
158
-
159
-
160
-
161
-
162
-
163
-
164
-
165
-
166
-
167
-
168
-
169
-
170
-
171
-
172
-
173
-
174
-
175
-
176
-
177
-
178
-
179
-
180
-
181
-
182
-
183
-
184
-
185
-
186
-
187
-
188
-
189
-
190
-
191
-
 192
192 -
 193
193 -
 194
194 -
 195
195 -
 196
196 -
 197
197 -
 198
198 -
 199
199 -
 200
200 -
 201
201 -
 202
202 -
 203
203 -
 204
204 -
 205
205 -
 206
206 -
 207
207
 |
 |

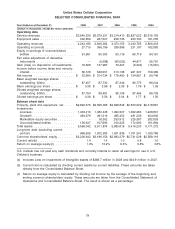
United States Cellular Corporation
FIVE-YEAR STATISTICAL SUMMARY
At or Year Ended December 31, 2008 2007 2006 2005 2004
(Dollars in thousands, except per share and per
customer amounts)
Market and customer statistics
Total number of consolidated markets(a) ..... 239 218 201 189 175
Customers .......................... 6,196,000 6,102,000 5,815,000 5,482,000 4,945,000
Total population(b)
Consolidated markets ................. 83,014,000 82,371,000 55,543,000 45,244,000 44,391,000
Consolidated operating markets .......... 46,009,000 44,955,000 44,043,000 43,362,000 39,893,000
Market penetration(c)
Consolidated markets ................. 7.5% 7.4% 10.5% 12.1% 11.1%
Consolidated operating markets .......... 13.5% 13.6% 13.2% 12.6% 12.4%
Net customer additions ................. 91,000 281,000 310,000 477,000 627,000
Postpay churn rate(d) .................. 1.5% 1.4% 1.6% 1.6% 1.5%
Average monthly service revenue per
customer(e) ....................... $ 53.23 $ 51.17 $ 47.23 $ 45.24 $ 46.58
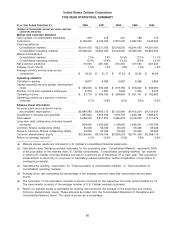
Operating statistics
Cell sites in service .................... 6,877 6,383 5,925 5,428 4,856
Capital expenditures and system development
costs ............................ $ 585,590 $ 565,495 $ 579,785 $ 576,525 $ 636,097
Number of full-time equivalent employees .... 8,470 7,837 7,608 7,300 6,725
Operating income ..................... $ 27,710 $ 396,199 $ 289,896 $ 231,197 $ 162,583
Operating income as a percent of service
revenues ......................... 0.7% 10.8% 9.0% 8.2% 6.2%
Balance sheet information
Property, plant and equipment before
accumulated depreciation .............. $5,884,383 $5,409,115 $5,120,994 $4,615,234 $4,104,200
Investment in licenses and goodwill ......... 1,927,694 1,973,762 1,979,779 1,843,498 1,683,631
Total assets ......................... 5,566,042 5,611,874 5,680,616 5,416,233 5,171,272
Long-term debt outstanding (includes forward
contracts) ......................... 996,636 1,002,293 1,196,695 1,296,241 1,190,786
Common Shares outstanding (000s) ........ 55,046 55,046 55,046 55,046 55,046
Series A Common Shares outstanding (000s) . . 33,006 33,006 33,006 33,006 33,006
Common shareholders’ equity ............ $3,206,642 $3,196,156 $2,993,279 $2,741,038 $2,588,116
Return on average equity(f) .............. 1.0% 10.2% 6.3% 5.8% 3.6%
(a) Markets whose results are included in U.S. Cellular’s consolidated financial statements.
(b) Calculated using Claritas population estimates for the preceding year. ‘‘Consolidated Markets’’ represents 100%
of the population of the markets that U.S. Cellular consolidates. ‘‘Consolidated operating markets’’ are markets
in which U.S. Cellular provides wireless services to customers as of December 31 of each year. This population
measurement is used only for purposes of calculating market penetration (without duplication of population in
overlapping markets).
(c) Calculated by dividing ‘‘Customers’’ by ‘‘Total population of consolidated markets’’ or ‘‘Total population of
consolidated operating markets.’’
(d) Postpay churn rate represents the percentage of the postpay customer base that disconnects service each
month.
(e) The numerator of this calculation consists of service revenues for the respective 12-month period divided by 12.
The denominator consists of the average number of U.S. Cellular wireless customers.
(f) Return on average equity is calculated by dividing net income by the average of the beginning and ending
Common shareholders’ equity. These amounts are taken from the Consolidated Statement of Operations and
Consolidated Balance Sheet. The result is shown as a percentage.
80