US Cellular 2008 Annual Report Download - page 52
Download and view the complete annual report
Please find page 52 of the 2008 US Cellular annual report below. You can navigate through the pages in the report by either clicking on the pages listed below, or by using the keyword search tool below to find specific information within the annual report.-
 1
1 -
2
-
3
-
4
-
5
-
6
-
7
-
8
-
9
-
10
-
11
-
12
-
13
-
14
-
15
-
16
-
17
-
18
-
19
-
20
-
21
-
22
-
23
-
24
-
25
-
26
-
27
-
28
-
29
-
30
-
31
-
32
-
33
-
34
-
35
-
36
-
37
-
38
-
39
-
40
-
41
-
 42
42 -
 43
43 -
 44
44 -
 45
45 -
 46
46 -
 47
47 -
 48
48 -
 49
49 -
 50
50 -
 51
51 -
 52
52 -
 53
53 -
 54
54 -
 55
55 -
 56
56 -
 57
57 -
 58
58 -
 59
59 -
 60
60 -
 61
61 -
 62
62 -
63
-
64
-
65
-
66
-
67
-
68
-
69
-
70
-
71
-
72
-
73
-
74
-
75
-
76
-
77
-
78
-
79
-
80
-
81
-
82
-
83
-
84
-
85
-
86
-
87
-
88
-
89
-
90
-
91
-
92
-
93
-
94
-
95
-
96
-
97
-
98
-
99
-
100
-
101
-
102
-
103
-
104
-
105
-
106
-
107
-
108
-
109
-
110
-
111
-
112
-
113
-
114
-
115
-
116
-
117
-
118
-
119
-
120
-
121
-
122
-
123
-
124
-
125
-
126
-
127
-
128
-
129
-
130
-
131
-
132
-
133
-
134
-
135
-
136
-
137
-
138
-
139
-
140
-
141
-
142
-
143
-
144
-
145
-
146
-
147
-
148
-
149
-
150
-
151
-
152
-
153
-
154
-
155
-
156
-
157
-
158
-
159
-
160
-
161
-
162
-
163
-
164
-
165
-
166
-
167
-
168
-
169
-
170
-
171
-
172
-
173
-
174
-
175
-
176
-
177
-
178
-
179
-
180
-
181
-
182
-
183
-
184
-
185
-
186
-
187
-
188
-
189
-
190
-
191
-
192
-
193
-
194
-
195
-
196
-
197
-
198
-
199
-
200
-
201
-
202
-
203
-
204
-
205
-
206
-
207
 |
 |

Mr. Ellison’s performance was considered to far exceed expectations as discussed above under
Performance Objectives and Accomplishments.
Michael S. Irizarry’s performance multiple was 2.31 based on information from Towers Perrin for an
officer at Mr. Irizarry’s level and performance, which is intended to provide awards at the 60th percentile.
Mr. Irizarry’s performance was considered to far exceed expectations as discussed above under
Performance Objectives and Accomplishments.
Jeffrey J. Childs’ performance multiple was 1.67 based on information from Towers Perrin for an
officer at Mr. Childs’ level and performance, which is intended to provide awards at the 60th percentile.
Mr. Childs’ performance was considered to far exceed expectations as discussed above under
Performance Objectives and Accomplishments.
As a result of the foregoing formulas and individual performance factors, the following stock options
and restricted stock units were granted to the named executive officers other than Mr. Rooney in 2008:
Number of Shares
Number of Shares Underlying
Underlying Restricted
Name Stock Options Stock Units
Steven T. Campbell ........................ 27,175 6,120
Jay M. Ellison ........................... 61,250 13,794
Michael S. Irizarry ......................... 44,150 9,943
Jeffrey J. Childs .......................... 26,225 5,903
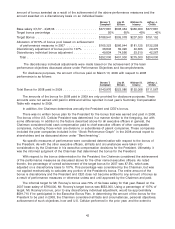
The following shows the calculation of stock options and restricted stock units.
Steven T. Jay M. Michael S. Jeffrey J.
Formula Campbell Ellison Irizarry Childs
a March 1, 2008 Base Salary ....... $423,000 $ 549,000 $ 496,800 $408,000
b Performance Multiple ........... 1.67 2.90 2.31 1.67
c Long Term Incentive Target Value . . a b $706,410 $1,592,100 $1,147,608 $681,360
d Option Value ................. c 60% $423,846 $ 955,260 $ 688,565 $408,816
e Closing Stock Price on April 1, 2008 $ 57.19 $ 57.19 $ 57.19 $ 57.19
f Closing Price Black-Scholes
Ratio ..................... e 30% $ 17.16 $ 17.16 $ 17.16 $ 17.16
g Adj. Price Option Vesting
Discount Factor ............. f 90.8% $ 15.57 $ 15.57 $ 15.57 $ 15.57
h Options Granted (rounded) ....... d / g 27,175 61,250 44,150 26,225
i RSU Value ................... c 40% $282,564 $ 636,840 $ 459,043 $272,544
j Company Performance % ........ 107% 107% 107% 107%
k Adjusted RSU Value ............ $302,343 $ 681,419 $ 491,176 $291,622
l Price RSU Vesting Discount
Factor .................... e 86.4% $ 49.41 $ 49.41 $ 49.41 $ 49.41
RSUs Granted ................ k / l 6,120 13,794 9,943 5,903
John E. Rooney’s stock option and restricted stock unit awards were made using a different
approach compared to the calculations shown above for the other named executive officers.
The value of Mr. Rooney’s target long-term incentive awards was based on benchmark information
from Towers Perrin based on the combined value of stock option and restricted stock grants for
comparable persons. As discussed above for the President’s base salary, the population of comparable
values of grants was comprised one-half of grant values for the chief executive officers of public
companies and one-half of grant values for the chief executive officers of subsidiaries of publicly-held
companies, similar in size to U.S. Cellular.
Mr. Rooney’s target allocation is based on a long-standing fixed dollar target approach to this
portion of his compensation. Mr. Rooney’s fixed dollar target restricted stock unit value was $411,290.
This was multiplied by the adjusted Company Performance percentage of 107% to derive an adjusted
45