US Cellular 2008 Annual Report Download - page 136
Download and view the complete annual report
Please find page 136 of the 2008 US Cellular annual report below. You can navigate through the pages in the report by either clicking on the pages listed below, or by using the keyword search tool below to find specific information within the annual report.-
 1
1 -
2
-
3
-
4
-
5
-
6
-
7
-
8
-
9
-
10
-
11
-
12
-
13
-
14
-
15
-
16
-
17
-
18
-
19
-
20
-
21
-
22
-
23
-
24
-
25
-
26
-
27
-
28
-
29
-
30
-
31
-
32
-
33
-
34
-
35
-
36
-
37
-
38
-
39
-
40
-
41
-
42
-
43
-
44
-
45
-
46
-
47
-
48
-
49
-
50
-
51
-
52
-
53
-
54
-
55
-
56
-
57
-
58
-
59
-
60
-
61
-
62
-
63
-
64
-
65
-
66
-
67
-
68
-
69
-
70
-
71
-
72
-
73
-
74
-
75
-
76
-
77
-
78
-
79
-
80
-
81
-
82
-
83
-
84
-
85
-
86
-
87
-
88
-
89
-
90
-
91
-
92
-
93
-
94
-
95
-
96
-
97
-
98
-
99
-
100
-
101
-
102
-
103
-
104
-
105
-
106
-
107
-
108
-
109
-
110
-
111
-
112
-
113
-
114
-
115
-
116
-
117
-
118
-
119
-
120
-
121
-
122
-
123
-
124
-
125
-
 126
126 -
 127
127 -
 128
128 -
 129
129 -
 130
130 -
 131
131 -
 132
132 -
 133
133 -
 134
134 -
 135
135 -
 136
136 -
 137
137 -
 138
138 -
 139
139 -
 140
140 -
 141
141 -
 142
142 -
 143
143 -
 144
144 -
 145
145 -
 146
146 -
147
-
148
-
149
-
150
-
151
-
152
-
153
-
154
-
155
-
156
-
157
-
158
-
159
-
160
-
161
-
162
-
163
-
164
-
165
-
166
-
167
-
168
-
169
-
170
-
171
-
172
-
173
-
174
-
175
-
176
-
177
-
178
-
179
-
180
-
181
-
182
-
183
-
184
-
185
-
186
-
187
-
188
-
189
-
190
-
191
-
192
-
193
-
194
-
195
-
196
-
197
-
198
-
199
-
200
-
201
-
202
-
203
-
204
-
205
-
206
-
207
 |
 |

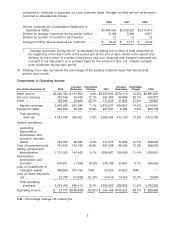
• Cash distributions from unconsolidated entities increased by $9.0 million.
• Changes in assets and liabilities from operations other than accrued taxes increased the net cash
inflow by $51.0 million. Such assets and liabilities required cash of $43.8 million in 2007 and
$94.8 million in 2006. The majority of this net change was attributable to a decrease in the inventory
balance, reflecting a lower number of handsets on hand.
• Income taxes paid reduced the net cash inflow by $64.9 million in 2007 compared to 2006. Such taxes
were $212.6 million and $147.7 million in 2007 and 2006, respectively. The 2007 income taxes were
higher primarily due to the 2007 gain on the disposition of Vodafone ADRs and the settlement of the
related forward contracts, and higher 2007 operating income relative to 2006.
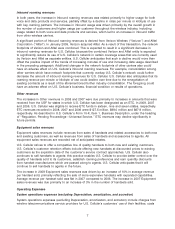
Cash Flows from Investing Activities
U.S. Cellular makes substantial investments each year to construct and upgrade modern high quality
wireless communications networks and facilities as a basis for creating long term value for shareholders.
In recent years, rapid changes in technology and new opportunities have required substantial
investments in revenue-enhancing and cost-reducing upgrades of U.S. Cellular’s networks. Cash flows
used for investing activities also represent cash required for the acquisition of wireless properties or
licenses. Proceeds from exchanges and divestiture transactions have provided funds in recent years
which have partially offset the cash requirements for investing activities; however, such sources cannot
be relied upon to provide continuing or regular sources of financing.
The primary purpose of U.S. Cellular’s construction and expansion expenditures is to provide for
customer and usage growth, to upgrade service and to take advantage of service-enhancing and
cost-reducing technological developments in order to maintain competitive services.
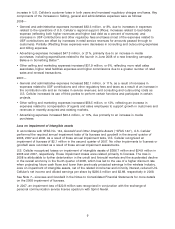
Cash used for property, plant and equipment and system development expenditures totaled
$585.6 million in 2008, $565.5 million in 2007 and $579.8 million in 2006. These expenditures were
financed primarily with internally generated cash and borrowings under U.S. Cellular’s revolving credit
facility. These expenditures were made to construct cell sites, increase capacity in existing cell sites and
switches, upgrade technology including the overlay of EVDO technology in certain markets, develop new
and enhance existing office systems, and construct new and remodel existing retail stores.
Cash required for acquisitions totaled $341.7 million in 2008, $21.5 million in 2007 and $145.7 million in
2006. U.S. Cellular’s acquisitions included primarily the purchase of interests in wireless markets and
wireless spectrum. The cash impact of 2008 acquisitions is summarized below.
2008 Acquisitions Cash Payment(1)
(Dollars in millions)
Auction 73 Licenses(2) ................................... $300.5
Missouri Licenses ....................................... 19.6
North Carolina RSA 1 Partnership ........................... 6.9
Maine Licenses ........................................ 5.0
Other ............................................... 9.7
Total ................................................ $341.7
(1) Cash amounts paid for the acquisitions differ from the purchase price due to transaction
related expenses incurred, but not yet paid, as of December 31, 2008.
(2) King Street Wireless L.P., an entity in which a subsidiary of U.S. Cellular is a limited partner
with a 90% partnership interest, made these payments. U.S. Cellular loaned these funds to
the partnership and the general partner and made direct capital investments to fund the
auction payment.
Significant acquisitions in 2007 and 2006 included U.S. Cellular’s 2007 purchase of 100% of the
membership interests of Iowa 15 Wireless, LLC for approximately $18.3 million in cash and U.S.
Cellular’s $127.1 million cash payment in 2006 for 17 licenses awarded in the 2006 FCC Auction 66.
14