US Cellular 2008 Annual Report Download - page 131
Download and view the complete annual report
Please find page 131 of the 2008 US Cellular annual report below. You can navigate through the pages in the report by either clicking on the pages listed below, or by using the keyword search tool below to find specific information within the annual report.-
 1
1 -
2
-
3
-
4
-
5
-
6
-
7
-
8
-
9
-
10
-
11
-
12
-
13
-
14
-
15
-
16
-
17
-
18
-
19
-
20
-
21
-
22
-
23
-
24
-
25
-
26
-
27
-
28
-
29
-
30
-
31
-
32
-
33
-
34
-
35
-
36
-
37
-
38
-
39
-
40
-
41
-
42
-
43
-
44
-
45
-
46
-
47
-
48
-
49
-
50
-
51
-
52
-
53
-
54
-
55
-
56
-
57
-
58
-
59
-
60
-
61
-
62
-
63
-
64
-
65
-
66
-
67
-
68
-
69
-
70
-
71
-
72
-
73
-
74
-
75
-
76
-
77
-
78
-
79
-
80
-
81
-
82
-
83
-
84
-
85
-
86
-
87
-
88
-
89
-
90
-
91
-
92
-
93
-
94
-
95
-
96
-
97
-
98
-
99
-
100
-
101
-
102
-
103
-
104
-
105
-
106
-
107
-
108
-
109
-
110
-
111
-
112
-
113
-
114
-
115
-
116
-
117
-
118
-
119
-
120
-
 121
121 -
 122
122 -
 123
123 -
 124
124 -
 125
125 -
 126
126 -
 127
127 -
 128
128 -
 129
129 -
 130
130 -
 131
131 -
 132
132 -
 133
133 -
 134
134 -
 135
135 -
 136
136 -
 137
137 -
 138
138 -
 139
139 -
 140
140 -
 141
141 -
142
-
143
-
144
-
145
-
146
-
147
-
148
-
149
-
150
-
151
-
152
-
153
-
154
-
155
-
156
-
157
-
158
-
159
-
160
-
161
-
162
-
163
-
164
-
165
-
166
-
167
-
168
-
169
-
170
-
171
-
172
-
173
-
174
-
175
-
176
-
177
-
178
-
179
-
180
-
181
-
182
-
183
-
184
-
185
-
186
-
187
-
188
-
189
-
190
-
191
-
192
-
193
-
194
-
195
-
196
-
197
-
198
-
199
-
200
-
201
-
202
-
203
-
204
-
205
-
206
-
207
 |
 |
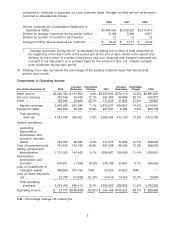
increase in U.S. Cellular’s customer base in both years and increased regulatory charges and taxes. Key
components of the increases in Selling, general and administrative expenses were as follows:
2008—
• General and administrative expenses increased $63.3 million, or 8%, due to increases in expenses
related to the operations of U.S. Cellular’s regional support offices; increases related to bad debts
expense (reflecting both higher revenues and higher bad debt as a percent of revenues); and
increases in USF contributions and other regulatory fees and taxes (most of the expenses related to
USF contributions are offset by increases in retail service revenues for amounts passed through to
customers). Partially offsetting these expenses were decreases in consulting and outsourcing expenses
and billing expenses.
• Advertising expenses increased $47.3 million, or 21%, primarily due to an increase in media
purchases, including expenditures related to the launch in June 2008 of a new branding campaign,
Believe in Something Better.
• Other selling and marketing expenses increased $31.9 million, or 6%, reflecting more retail sales
associates, higher retail facilities expenses and higher commissions due to a greater number of retail
sales and renewal transactions.
2007—
• General and administrative expenses increased $82.1 million, or 11%, as a result of increases in
expenses related to USF contributions and other regulatory fees and taxes as a result of an increase in
the contribution rate and an increase in service revenues; and consulting and outsourcing costs as
U.S. Cellular increased its use of third parties to perform certain functions and participate in certain
projects.
• Other selling and marketing expenses increased $56.5 million, or 12%, reflecting an increase in
expenses related to compensation of agents and sales employees to support growth in customers and
revenues in recently acquired and existing markets.
• Advertising expenses increased $20.4 million, or 10%, due primarily to an increase in media
purchases.
Loss on impairment of intangible assets
In accordance with SFAS No. 142, Goodwill and Other Intangible Assets (‘‘SFAS 142’’), U.S. Cellular
performed the required annual impairment tests of its licenses and goodwill in the second quarter of
2008, 2007 and 2006. As a result of these annual impairment tests, U.S. Cellular recognized an
impairment of licenses of $2.1 million in the second quarter of 2007. No other impairments to licenses or
goodwill were recorded as a result of these annual impairment assessments.
U.S. Cellular recognized losses on impairment of intangible assets of $386.7 million and $24.9 million in
2008 and 2007, respectively. These impairment losses were related primarily to licenses. The loss in
2008 is attributable to further deterioration in the credit and financial markets and the accelerated decline
in the overall economy in the fourth quarter of 2008, which has led to the use of a higher discount rate
when projecting future cash flows and lower than previously projected earnings in the wireless industry.
Loss on impairment of intangible assets, net of the related income tax and minority interest, reduced U.S.
Cellular’s net income and diluted earnings per share by $236.3 million and $2.69, respectively in 2008.
See Note 7—Licenses and Goodwill in the Notes to Consolidated Financial Statements for more details
on the 2008 impairment of licenses.
In 2007, an impairment loss of $20.8 million was recognized in conjunction with the exchange of
personal communication service license spectrum with Sprint Nextel.
9