US Cellular 2008 Annual Report Download - page 203
Download and view the complete annual report
Please find page 203 of the 2008 US Cellular annual report below. You can navigate through the pages in the report by either clicking on the pages listed below, or by using the keyword search tool below to find specific information within the annual report.-
 1
1 -
2
-
3
-
4
-
5
-
6
-
7
-
8
-
9
-
10
-
11
-
12
-
13
-
14
-
15
-
16
-
17
-
18
-
19
-
20
-
21
-
22
-
23
-
24
-
25
-
26
-
27
-
28
-
29
-
30
-
31
-
32
-
33
-
34
-
35
-
36
-
37
-
38
-
39
-
40
-
41
-
42
-
43
-
44
-
45
-
46
-
47
-
48
-
49
-
50
-
51
-
52
-
53
-
54
-
55
-
56
-
57
-
58
-
59
-
60
-
61
-
62
-
63
-
64
-
65
-
66
-
67
-
68
-
69
-
70
-
71
-
72
-
73
-
74
-
75
-
76
-
77
-
78
-
79
-
80
-
81
-
82
-
83
-
84
-
85
-
86
-
87
-
88
-
89
-
90
-
91
-
92
-
93
-
94
-
95
-
96
-
97
-
98
-
99
-
100
-
101
-
102
-
103
-
104
-
105
-
106
-
107
-
108
-
109
-
110
-
111
-
112
-
113
-
114
-
115
-
116
-
117
-
118
-
119
-
120
-
121
-
122
-
123
-
124
-
125
-
126
-
127
-
128
-
129
-
130
-
131
-
132
-
133
-
134
-
135
-
136
-
137
-
138
-
139
-
140
-
141
-
142
-
143
-
144
-
145
-
146
-
147
-
148
-
149
-
150
-
151
-
152
-
153
-
154
-
155
-
156
-
157
-
158
-
159
-
160
-
161
-
162
-
163
-
164
-
165
-
166
-
167
-
168
-
169
-
170
-
171
-
172
-
173
-
174
-
175
-
176
-
177
-
178
-
179
-
180
-
181
-
182
-
183
-
184
-
185
-
186
-
187
-
188
-
189
-
190
-
191
-
192
-
 193
193 -
 194
194 -
 195
195 -
 196
196 -
 197
197 -
 198
198 -
 199
199 -
 200
200 -
 201
201 -
 202
202 -
 203
203 -
 204
204 -
 205
205 -
 206
206 -
 207
207
 |
 |

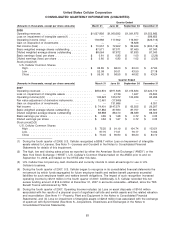
United States Cellular Corporation
CONSOLIDATED QUARTERLY INFORMATION (UNAUDITED)
Quarter Ended
(Amounts in thousands, except per share amounts) March 31 June 30 September 30 December 31
2008
Operating revenues .......................... $1,037,856 $1,060,592 $1,091,875 $1,052,862
Loss on impairment of intangible assets(1) ........... — — — 386,653
Operating income (loss) ....................... 118,966 117,902 119,957 (329,115)
Gain on disposition of investments ................ — — 16,628 —
Net income (loss) ............................ $ 70,557 $ 72,602 $ 89,949 $ (200,118)
Basic weighted average shares outstanding .......... 87,571 87,571 87,460 87,340
Diluted weighted average shares outstanding ......... 88,064 87,872 87,833 87,340
Basic earnings (loss) per share ................... $ 0.81 $ 0.83 $ 1.03 $ (2.29)
Diluted earnings (loss) per share ................. $ 0.80 $ 0.83 $ 1.02 $ (2.29)
Stock price(2)(3)
U.S. Cellular Common Shares
High .................................. $ 85.85 $ 68.00 $ 63.00 $ 47.90
Low .................................. 52.08 50.01 43.50 27.18
Close ................................. $ 55.00 $ 56.55 $ 46.92 $ 43.24
Quarter Ended
(Amounts in thousands, except per share amounts) March 31 June 30 September 30 December 31
2007
Operating revenues ............................. $934,674 $971,646 $1,015,834 $1,024,110
Loss on impairment of intangible assets ............... — 2,136 1,947 20,840
Operating income(4)(5) .......................... 108,523 123,472 100,939 63,265
Fair value adjustment of derivative instruments ........... 12,461 (17,849) — —
Gain on disposition of investments ................... — 131,686 — 6,301
Net income .................................. $ 74,401 $147,571 $ 63,555 $ 29,207
Basic weighted average shares outstanding ............ 87,882 87,590 87,757 87,691
Diluted weighted average shares outstanding ........... 88,688 88,410 88,589 88,309
Basic earnings per share ......................... $ 0.85 $ 1.68 $ 0.72 $ 0.33
Diluted earnings per share ........................ $ 0.84 $ 1.67 $ 0.72 $ 0.33
Stock price(2)(3)
U.S. Cellular Common Shares
High .................................... $ 75.25 $ 91.19 $ 104.74 $ 103.51
Low..................................... 67.70 71.01 76.17 74.62
Close ................................... $ 73.45 $ 90.60 $ 98.20 $ 84.10
(1) During the fourth quarter of 2008, U.S. Cellular recognized a $386.7 million Loss on Impairment of intangible
assets related to Licenses. See Note 7—Licenses and Goodwill in the Notes to Consolidated Financial
Statements for details of this impairment.
(2) The high, low and closing sales prices as reported by either the American Stock Exchange (‘‘AMEX’’) or the
New York Stock Exchange (‘‘NYSE’’). U.S. Cellular’s Common Shares traded on the AMEX prior to and on
September 14, 2008, and traded on the NYSE after this date.
(3) U.S. Cellular has not paid any cash dividends and currently intends to retain all earnings for use in U.S.
Cellular’s business.
(4) During the fourth quarter of 2007, U.S. Cellular began to recognize in its consolidated financial statements the
net amount by which funds segregated for future employee health and welfare benefit payments exceeded
liabilities for such employee health and welfare benefit obligations. The impact of such recognition increased
operating income by $12.6 million in the fourth quarter of 2007. Additionally, U.S. Cellular recorded this net
excess funding amount of $12.6 million at December 31, 2007 in accounts receivable—affiliated, since the TDS
Benefit Trust is administered by TDS.
(5) During the fourth quarter of 2007, Operating Income includes: (a) Loss on asset disposals of $14.6 million
associated with the results of a physical count of significant cell site and switch assets and the related valuation
and reconciliation (See Note 11—Property, Plant and Equipment in the Notes to Consolidated Financial
Statements), and (b) Loss on impairment of intangible assets of $20.8 million loss associated with the exchange
of spectrum with Sprint Nextel (See Note 6—Acquisitions, Divestitures and Exchanges in the Notes to
Consolidated Financial Statements).
81