US Cellular 2008 Annual Report Download - page 135
Download and view the complete annual report
Please find page 135 of the 2008 US Cellular annual report below. You can navigate through the pages in the report by either clicking on the pages listed below, or by using the keyword search tool below to find specific information within the annual report.-
 1
1 -
2
-
3
-
4
-
5
-
6
-
7
-
8
-
9
-
10
-
11
-
12
-
13
-
14
-
15
-
16
-
17
-
18
-
19
-
20
-
21
-
22
-
23
-
24
-
25
-
26
-
27
-
28
-
29
-
30
-
31
-
32
-
33
-
34
-
35
-
36
-
37
-
38
-
39
-
40
-
41
-
42
-
43
-
44
-
45
-
46
-
47
-
48
-
49
-
50
-
51
-
52
-
53
-
54
-
55
-
56
-
57
-
58
-
59
-
60
-
61
-
62
-
63
-
64
-
65
-
66
-
67
-
68
-
69
-
70
-
71
-
72
-
73
-
74
-
75
-
76
-
77
-
78
-
79
-
80
-
81
-
82
-
83
-
84
-
85
-
86
-
87
-
88
-
89
-
90
-
91
-
92
-
93
-
94
-
95
-
96
-
97
-
98
-
99
-
100
-
101
-
102
-
103
-
104
-
105
-
106
-
107
-
108
-
109
-
110
-
111
-
112
-
113
-
114
-
115
-
116
-
117
-
118
-
119
-
120
-
121
-
122
-
123
-
124
-
 125
125 -
 126
126 -
 127
127 -
 128
128 -
 129
129 -
 130
130 -
 131
131 -
 132
132 -
 133
133 -
 134
134 -
 135
135 -
 136
136 -
 137
137 -
 138
138 -
 139
139 -
 140
140 -
 141
141 -
 142
142 -
 143
143 -
 144
144 -
 145
145 -
146
-
147
-
148
-
149
-
150
-
151
-
152
-
153
-
154
-
155
-
156
-
157
-
158
-
159
-
160
-
161
-
162
-
163
-
164
-
165
-
166
-
167
-
168
-
169
-
170
-
171
-
172
-
173
-
174
-
175
-
176
-
177
-
178
-
179
-
180
-
181
-
182
-
183
-
184
-
185
-
186
-
187
-
188
-
189
-
190
-
191
-
192
-
193
-
194
-
195
-
196
-
197
-
198
-
199
-
200
-
201
-
202
-
203
-
204
-
205
-
206
-
207
 |
 |

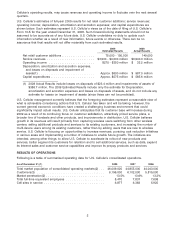
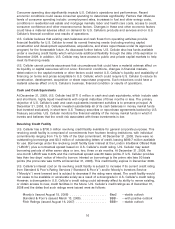
FINANCIAL RESOURCES
U.S. Cellular operates a capital- and marketing-intensive business. In recent years, U.S. Cellular has
generated cash from its operating activities, received cash proceeds from divestitures, used short-term
credit facilities and used long-term debt financing to fund its acquisitions including licenses, construction
costs and operating expenses. Cash flows may fluctuate from quarter to quarter and year to year due to
seasonality, the timing of acquisitions, capital expenditures and other factors. The table below and the
following discussion in this Financial Resources section summarize U.S. Cellular’s cash flow activities in
2008, 2007 and 2006.
Year Ended December 31, 2008 2007 2006
(Dollars in thousands)
Cash flows from (used in)
Operating activities ............................ $922,777 $ 863,078 $ 701,068
Investing activities ............................ (904,027) (579,481) (596,189)
Financing activities ............................ (52,287) (111,976) (100,970)
Net increase (decrease) in cash and cash equivalents .... $ (33,537) $ 171,621 $ 3,909
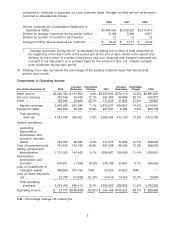
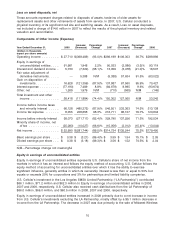
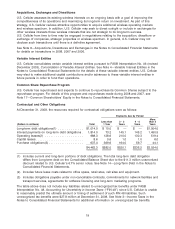
Cash Flows from Operating Activities
(Dollars in millions) 2008 2007 2006
Operating income other than non-cash items .............. $1,103.0 $1,114.9 $ 947.1
Non-cash items
Depreciation, amortization and accretion ................ (576.9) (578.2) (555.6)
Bad debt expense ................................ (73.2) (66.9) (62.0)
Stock-based compensation expense ................... (15.1) (14.7) (20.0)
Loss on impairment of intangible assets ................ (386.7) (24.9) —
Loss on asset disposals, net ........................ (23.4) (34.0) (19.6)
Operating income ................................. $ 27.7 $ 396.2 $ 289.9
U.S. Cellular management believes the foregoing information provides useful information to investors
regarding U.S. Cellular’s financial condition and results of operations because it breaks out and shows
the components and impact of cash and non-cash items on cash flows from operating activities.
Cash flows from operating activities in 2008 were $922.8 million, up $59.7 million from 2007. Key
changes included the following:
• Income taxes paid decreased $96.1 million in 2008 compared to 2007. Income tax payments in 2008
and 2007 were $116.5 million and $212.6 million, respectively. The 2007 income tax payments were
higher than the 2008 payments primarily due to increased estimated tax payments that resulted from
the gain on the disposition of Vodafone ADRs and the settlement of the related forward contracts.
• Changes in assets and liabilities from operations other than accrued taxes increased the net cash
outflow by $33.0 million. Such assets and liabilities required cash of $76.8 million in 2008 and
$43.8 million in 2007. The change in accounts receivable required $68.0 million and $98.6 million in
2008 and 2007, respectively. This difference was primarily attributable to a $12.5 million receivable
from an affiliate that was accrued in 2007 and then paid in 2008. In addition, the change in inventory
required $15.6 million in 2008 and provided $16.3 million in 2007. The increase in inventory during
2008 was attributable to more handsets on hand at December 31, 2008 relative to December 31, 2007,
partially as a result of additional retail stores that commenced operations during 2008.
Cash flows from operating activities in 2007 were $863.1 million, up $162.0 million from 2006. Key
changes included the following:
• Operating income adjusted for non-cash items, as shown in the table above, increased by
$167.8 million, from $947.1 million in 2006 to $1,114.9 million in 2007.
13