Time Magazine 2009 Annual Report Download - page 94
Download and view the complete annual report
Please find page 94 of the 2009 Time Magazine annual report below. You can navigate through the pages in the report by either clicking on the pages listed below, or by using the keyword search tool below to find specific information within the annual report.-
 1
1 -
2
-
3
-
4
-
5
-
6
-
7
-
8
-
9
-
10
-
11
-
12
-
13
-
14
-
15
-
16
-
17
-
18
-
19
-
20
-
21
-
22
-
23
-
24
-
25
-
26
-
27
-
28
-
29
-
30
-
31
-
32
-
33
-
34
-
35
-
36
-
37
-
38
-
39
-
40
-
41
-
42
-
43
-
44
-
45
-
46
-
47
-
48
-
49
-
50
-
51
-
52
-
53
-
54
-
55
-
56
-
57
-
58
-
59
-
60
-
61
-
62
-
63
-
64
-
65
-
66
-
67
-
68
-
69
-
70
-
71
-
72
-
73
-
74
-
75
-
76
-
77
-
78
-
79
-
80
-
81
-
82
-
83
-
 84
84 -
 85
85 -
 86
86 -
 87
87 -
 88
88 -
 89
89 -
 90
90 -
 91
91 -
 92
92 -
 93
93 -
 94
94 -
 95
95 -
 96
96 -
 97
97 -
 98
98 -
 99
99 -
 100
100 -
 101
101 -
 102
102 -
 103
103 -
 104
104 -
105
-
106
-
107
-
108
-
109
-
110
-
111
-
112
-
113
-
114
-
115
-
116
-
117
-
118
-
119
-
120
-
121
-
122
-
123
-
124
-
125
-
126
-
127
-
128
-
129
-
130
-
131
-
132
-
133
-
134
-
135
-
136
-
137
-
138
-
139
-
140
-
141
-
142
-
143
-
144
-
145
-
146
-
147
-
148
-
149
-
150
-
151
-
152
-
153
-
154
 |
 |

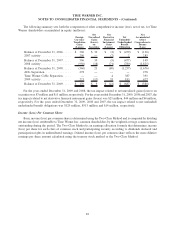
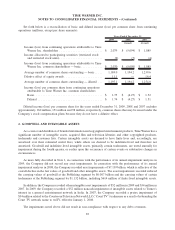
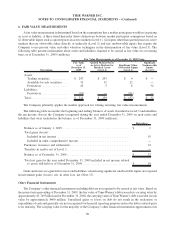
The following summary sets forth the components of other comprehensive income (loss), net of tax, for Time
Warner shareholders accumulated in equity (millions):
Foreign
Currency
Translation
Gains
(Losses)
Net
Unrealized
Gains
(Losses)
on
Securities
Net
Derivative
Financial
Instrument
Gains
(Losses)
Net
Unfunded/
Underfunded
Benefit
Obligation
Net
Accumulated
Other
Comprehensive
Income
(Loss)
Balance at December 31, 2006..... $ 306 $ 39 $ (2) $ (479) $ (136)
2007 activity .................. 290 — (7) 2 285
Balance at December 31, 2007..... 596 39 (9) (477) 149
2008 activity .................. (956) (18) (71) (780) (1,825)
Balance at December 31, 2008..... (360) 21 (80) (1,257) (1,676)
AOL Separation................ 278 — — — 278
Time Warner Cable Separation..... — — 4 387 391
2009 activity .................. 221 (12) 35 183 427
Balance at December 31, 2009..... $ 139 $ 9 $ (41) $ (687) $ (580)
For the years ended December 31, 2009 and 2008, the tax impact related to net unrealized gains (losses) on
securities was $7 million and $11 million, respectively. For the years ended December 31, 2009, 2008 and 2007, the
tax impact related to net derivative financial instrument gains (losses) was $21 million, $44 million and $4 million,
respectively. For the years ended December 31, 2009, 2008 and 2007, the tax impact related to net unfunded/
underfunded benefit obligations was $129 million, $515 million and $14 million, respectively.
Income (Loss) Per Common Share
Basic income (loss) per common share is determined using the Two-Class Method and is computed by dividing
net income (loss) attributable to Time Warner Inc. common shareholders by the weighted-average common shares
outstanding during the period. The Two-Class Method is an earnings allocation formula that determines income
(loss) per share for each class of common stock and participating security according to dividends declared and
participation rights in undistributed earnings. Diluted income (loss) per common share reflects the more dilutive
earnings per share amount calculated using the treasury stock method or the Two-Class Method.
82
TIME WARNER INC.
NOTES TO CONSOLIDATED FINANCIAL STATEMENTS – (Continued)