Time Magazine 2009 Annual Report Download - page 46
Download and view the complete annual report
Please find page 46 of the 2009 Time Magazine annual report below. You can navigate through the pages in the report by either clicking on the pages listed below, or by using the keyword search tool below to find specific information within the annual report.-
 1
1 -
2
-
3
-
4
-
5
-
6
-
7
-
8
-
9
-
10
-
11
-
12
-
13
-
14
-
15
-
16
-
17
-
18
-
19
-
20
-
21
-
22
-
23
-
24
-
25
-
26
-
27
-
28
-
29
-
30
-
31
-
32
-
33
-
34
-
35
-
 36
36 -
 37
37 -
 38
38 -
 39
39 -
 40
40 -
 41
41 -
 42
42 -
 43
43 -
 44
44 -
 45
45 -
 46
46 -
 47
47 -
 48
48 -
 49
49 -
 50
50 -
 51
51 -
 52
52 -
 53
53 -
 54
54 -
 55
55 -
 56
56 -
57
-
58
-
59
-
60
-
61
-
62
-
63
-
64
-
65
-
66
-
67
-
68
-
69
-
70
-
71
-
72
-
73
-
74
-
75
-
76
-
77
-
78
-
79
-
80
-
81
-
82
-
83
-
84
-
85
-
86
-
87
-
88
-
89
-
90
-
91
-
92
-
93
-
94
-
95
-
96
-
97
-
98
-
99
-
100
-
101
-
102
-
103
-
104
-
105
-
106
-
107
-
108
-
109
-
110
-
111
-
112
-
113
-
114
-
115
-
116
-
117
-
118
-
119
-
120
-
121
-
122
-
123
-
124
-
125
-
126
-
127
-
128
-
129
-
130
-
131
-
132
-
133
-
134
-
135
-
136
-
137
-
138
-
139
-
140
-
141
-
142
-
143
-
144
-
145
-
146
-
147
-
148
-
149
-
150
-
151
-
152
-
153
-
154
 |
 |

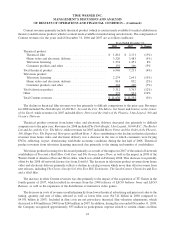
with a decline in home video revenues. Film costs increased to $4.789 billion in 2009 from $4.741 billion in 2008.
Included in film costs are net pre-release theatrical film valuation adjustments, which increased slightly to
$85 million in 2009 from $84 million in 2008. In addition, in 2009, the Company recognized a net benefit of
approximately $50 million related to adjustments to correct prior period participation accruals, and, in 2008, the
Company recognized approximately $53 million in participation expense related to claims on films released in prior
periods. Costs of revenues as a percentage of revenues was 71% in 2009 compared to 72% in 2008.
The decrease in selling, general and administrative expenses was primarily the result of lower employee costs
resulting from the operational reorganization of the New Line business in 2008 and Warner Bros.’ restructuring
activities in 2009, discussed below, as well as lower distribution expenses primarily associated with the declines in
Home video and electronic delivery revenues.
As previously noted under “Significant Transactions and Other Items Affecting Comparability,” the 2009
results included a $33 million loss on the sale of Warner Bros.’ Italian cinema assets. In addition, beginning in the
first quarter of 2009, Warner Bros. commenced a significant restructuring, primarily consisting of headcount
reductions and the outsourcing of certain functions to an external service provider. The Filmed Entertainment
segment incurred restructuring charges of $105 million in 2009, and expects to incur additional restructuring
charges of approximately $10 million in the first quarter of 2010. The 2008 results included restructuring charges of
$142 million primarily related to involuntary employee terminations in connection with the operational
reorganization of the New Line business.
Operating Income before Depreciation and Amortization increased primarily due to lower costs of revenues
and selling, general and administrative expenses, partly offset by a decrease in revenues and the negative impact of
foreign exchange rates. Operating Income before Depreciation and Amortization also included the effect of lower
than anticipated home video catalog returns of approximately $40 million, a $26 million benefit in connection with
the resolution of an international VAT matter and the $33 million loss on the sale of the Italian cinema assets.
The increase in Operating Income was primarily due to the increase in Operating Income before Depreciation
and Amortization, as well as a decrease in amortization expense primarily relating to film library assets.
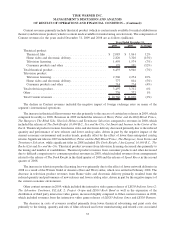
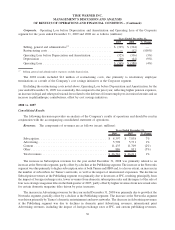
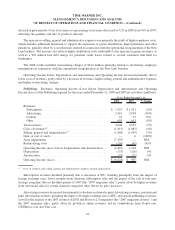
Publishing. Revenues, Operating Income (Loss) before Depreciation and Amortization and Operating
Income (Loss) of the Publishing segment for the years ended December 31, 2009 and 2008 are as follows (millions):
2009 2008 % Change
Years Ended December 31,
Revenues:
Subscription ........................................ $1,324 $ 1,523 (13%)
Advertising ......................................... 1,878 2,419 (22%)
Content ............................................ 73 63 16%
Other.............................................. 461 603 (24%)
Total revenues ......................................... 3,736 4,608 (19%)
Costs of revenues
(a)
..................................... (1,441) (1,813) (21%)
Selling, general and administrative
(a)
........................ (1,744) (1,840) (5%)
Asset impairments ...................................... (33) (7,195) NM
Restructuring costs ..................................... (99) (176) (44%)
Operating Income (Loss) before Depreciation and Amortization .... 419 (6,416) NM
Depreciation .......................................... (126) (133) (5%)
Amortization .......................................... (47) (75) (37%)
Operating Income (Loss) ................................. $ 246 $(6,624) NM
(a)
Costs of revenues and selling, general and administrative expenses exclude depreciation.
34
TIME WARNER INC.
MANAGEMENT’S DISCUSSION AND ANALYSIS
OF RESULTS OF OPERATIONS AND FINANCIAL CONDITION – (Continued)