Time Magazine 2009 Annual Report Download - page 74
Download and view the complete annual report
Please find page 74 of the 2009 Time Magazine annual report below. You can navigate through the pages in the report by either clicking on the pages listed below, or by using the keyword search tool below to find specific information within the annual report.-
 1
1 -
2
-
3
-
4
-
5
-
6
-
7
-
8
-
9
-
10
-
11
-
12
-
13
-
14
-
15
-
16
-
17
-
18
-
19
-
20
-
21
-
22
-
23
-
24
-
25
-
26
-
27
-
28
-
29
-
30
-
31
-
32
-
33
-
34
-
35
-
36
-
37
-
38
-
39
-
40
-
41
-
42
-
43
-
44
-
45
-
46
-
47
-
48
-
49
-
50
-
51
-
52
-
53
-
54
-
55
-
56
-
57
-
58
-
59
-
60
-
61
-
62
-
63
-
 64
64 -
 65
65 -
 66
66 -
 67
67 -
 68
68 -
 69
69 -
 70
70 -
 71
71 -
 72
72 -
 73
73 -
 74
74 -
 75
75 -
 76
76 -
 77
77 -
 78
78 -
 79
79 -
 80
80 -
 81
81 -
 82
82 -
 83
83 -
 84
84 -
85
-
86
-
87
-
88
-
89
-
90
-
91
-
92
-
93
-
94
-
95
-
96
-
97
-
98
-
99
-
100
-
101
-
102
-
103
-
104
-
105
-
106
-
107
-
108
-
109
-
110
-
111
-
112
-
113
-
114
-
115
-
116
-
117
-
118
-
119
-
120
-
121
-
122
-
123
-
124
-
125
-
126
-
127
-
128
-
129
-
130
-
131
-
132
-
133
-
134
-
135
-
136
-
137
-
138
-
139
-
140
-
141
-
142
-
143
-
144
-
145
-
146
-
147
-
148
-
149
-
150
-
151
-
152
-
153
-
154
 |
 |

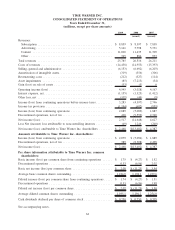
TIME WARNER INC.
CONSOLIDATED STATEMENT OF OPERATIONS
Years Ended December 31,
(millions, except per share amounts)
2009 2008 2007
(recast) (recast)
Revenues:
Subscription ............................................. $ 8,859 $ 8,397 $ 7,838
Advertising .............................................. 5,161 5,798 5,731
Content ................................................ 11,020 11,435 11,709
Other .................................................. 745 886 933
Total revenues ............................................. 25,785 26,516 26,211
Costs of revenues ........................................... (14,438) (14,953) (15,393)
Selling, general and administrative .............................. (6,153) (6,692) (6,203)
Amortization of intangible assets................................ (319) (356) (306)
Restructuring costs .......................................... (212) (327) (114)
Asset impairments .......................................... (85) (7,213) (34)
Gain (loss) on sale of assets ................................... (33) (3) 6
Operating income (loss) ...................................... 4,545 (3,028) 4,167
Interest expense, net ......................................... (1,155) (1,325) (1,412)
Other loss, net ............................................. (107) (44) (9)
Income (loss) from continuing operations before income taxes .......... 3,283 (4,397) 2,746
Income tax provision ........................................ (1,194) (692) (859)
Income (loss) from continuing operations ......................... 2,089 (5,089) 1,887
Discontinued operations, net of tax .............................. 428 (9,559) 2,740
Net income (loss) ........................................... 2,517 (14,648) 4,627
Less Net (income) loss attributable to noncontrolling interests .......... (49) 1,246 (240)
Net income (loss) attributable to Time Warner Inc. shareholders ........ $ 2,468 $(13,402) $ 4,387
Amounts attributable to Time Warner Inc. shareholders:
Income (loss) from continuing operations ......................... $ 2,079 $ (5,094) $ 1,889
Discontinued operations, net of tax .............................. 389 (8,308) 2,498
Net income (loss) ........................................... $ 2,468 $(13,402) $ 4,387
Per share information attributable to Time Warner Inc. common
shareholders:
Basic income (loss) per common share from continuing operations ...... $ 1.75 $ (4.27) $ 1.52
Discontinued operations ...................................... 0.33 (6.96) 2.02
Basic net income (loss) per common share . . . ..................... $ 2.08 $ (11.23) $ 3.54
Average basic common shares outstanding......................... 1,184.0 1,194.2 1,239.6
Diluted income (loss) per common share from continuing operations ..... $ 1.74 $ (4.27) $ 1.51
Discontinued operations ...................................... 0.33 (6.96) 1.99
Diluted net income (loss) per common share . . ..................... $ 2.07 $ (11.23) $ 3.50
Average diluted common shares outstanding . . ..................... 1,195.1 1,194.2 1,254.0
Cash dividends declared per share of common stock ................. $ 0.750 $ 0.750 $ 0.705
See accompanying notes.
62