Time Magazine 2009 Annual Report Download - page 49
Download and view the complete annual report
Please find page 49 of the 2009 Time Magazine annual report below. You can navigate through the pages in the report by either clicking on the pages listed below, or by using the keyword search tool below to find specific information within the annual report.-
 1
1 -
2
-
3
-
4
-
5
-
6
-
7
-
8
-
9
-
10
-
11
-
12
-
13
-
14
-
15
-
16
-
17
-
18
-
19
-
20
-
21
-
22
-
23
-
24
-
25
-
26
-
27
-
28
-
29
-
30
-
31
-
32
-
33
-
34
-
35
-
36
-
37
-
38
-
 39
39 -
 40
40 -
 41
41 -
 42
42 -
 43
43 -
 44
44 -
 45
45 -
 46
46 -
 47
47 -
 48
48 -
 49
49 -
 50
50 -
 51
51 -
 52
52 -
 53
53 -
 54
54 -
 55
55 -
 56
56 -
 57
57 -
 58
58 -
 59
59 -
60
-
61
-
62
-
63
-
64
-
65
-
66
-
67
-
68
-
69
-
70
-
71
-
72
-
73
-
74
-
75
-
76
-
77
-
78
-
79
-
80
-
81
-
82
-
83
-
84
-
85
-
86
-
87
-
88
-
89
-
90
-
91
-
92
-
93
-
94
-
95
-
96
-
97
-
98
-
99
-
100
-
101
-
102
-
103
-
104
-
105
-
106
-
107
-
108
-
109
-
110
-
111
-
112
-
113
-
114
-
115
-
116
-
117
-
118
-
119
-
120
-
121
-
122
-
123
-
124
-
125
-
126
-
127
-
128
-
129
-
130
-
131
-
132
-
133
-
134
-
135
-
136
-
137
-
138
-
139
-
140
-
141
-
142
-
143
-
144
-
145
-
146
-
147
-
148
-
149
-
150
-
151
-
152
-
153
-
154
 |
 |
as well as the impacts of the 2007 closures of LIFE and Business 2.0 magazines and the sale of four non-strategic
magazine titles in the third quarter of 2007, partly offset by growth in online revenues.
The decrease in Content revenues for the year ended December 31, 2008 was principally related to a decline at
the Filmed Entertainment segment, mainly due to decreases in both television and theatrical product revenues,
partially offset by the impact of the acquisition of TT Games Limited (“TT Games”) in the fourth quarter of 2007.
Each of the revenue categories is discussed in greater detail by segment in “Business Segment Results.”
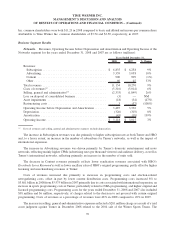
Costs of Revenues. For 2008 and 2007, costs of revenues totaled $14.953 billion and $15.393 billion,
respectively, and, as a percentage of revenues, were 56% and 59%, respectively. The segment variations are
discussed in detail in “Business Segment Results.”
Selling, General and Administrative Expenses. Selling, general and administrative expenses increased 8%
to $6.692 billion in 2008 from $6.203 billion in 2007, primarily related to increases at the Networks and Filmed
Entertainment segments, partially offset by a decline at the Publishing segment. The segment variations are
discussed in detail in “Business Segment Results.”
Included in selling general and administrative expenses are amounts related to securities litigation. The
Company recognized legal reserves as well as legal and other professional fees related to the defense of various
securities lawsuits totaling $21 million and $180 million in 2008 and 2007, respectively. In addition, the Company
recognized related insurance recoveries of $9 million in 2007.
Included in costs of revenues and selling, general and administrative expenses is depreciation expense, which
increased to $670 million in 2008 from $626 million in 2007.
Amortization Expense. Amortization expense increased to $356 million in 2008 from $306 million in 2007,
related to increases at the Networks and Filmed Entertainment segments, primarily due to business acquisitions.
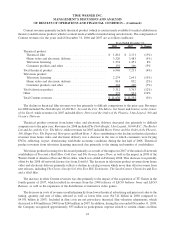
Restructuring Costs. During the year ended December 31, 2008, the Company incurred restructuring costs of
$327 million, primarily related to various employee terminations and other exit activities, including $142 million at
the Filmed Entertainment segment, $176 million at the Publishing segment and $12 million at the Corporate
segment, partially offset by a reversal of $3 million at the Networks segment. The total number of employees
terminated across the segments in 2008 was approximately 1,700.
During the year ended December 31, 2007, the Company incurred restructuring costs of $114 million, primarily
related to various employee terminations and other exit activities, including $37 million at the Networks segment,
$67 million at the Publishing segment and $10 million at the Corporate segment. The total number of employees
terminated across the segments in 2007 was approximately 600.
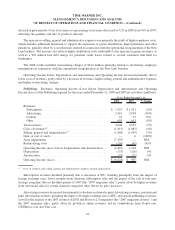
Operating Income (Loss). Operating Loss was $3.028 billion in 2008 compared to Operating Income of
$4.167 billion in 2007. Excluding the items previously noted under “Significant Transactions and Other
Items Affecting Comparability” totaling $7.237 billion and $199 million of expense, net for 2008 and 2007,
respectively, Operating Income (Loss) decreased $157 million, primarily reflecting declines at the Publishing and
Filmed Entertainment segments, partially offset by growth at the Networks segment and decreased expenses at the
Corporate segment. The segment variations are discussed under “Business Segment Results.”
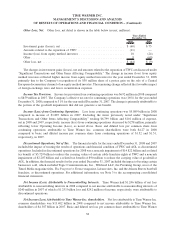
Interest Expense, Net. Interest expense, net, decreased to $1.325 billion in 2008 from $1.412 billion in 2007,
primarily due to lower average interest rates on net debt.
37
TIME WARNER INC.
MANAGEMENT’S DISCUSSION AND ANALYSIS
OF RESULTS OF OPERATIONS AND FINANCIAL CONDITION – (Continued)