Time Magazine 2009 Annual Report Download - page 48
Download and view the complete annual report
Please find page 48 of the 2009 Time Magazine annual report below. You can navigate through the pages in the report by either clicking on the pages listed below, or by using the keyword search tool below to find specific information within the annual report.-
 1
1 -
2
-
3
-
4
-
5
-
6
-
7
-
8
-
9
-
10
-
11
-
12
-
13
-
14
-
15
-
16
-
17
-
18
-
19
-
20
-
21
-
22
-
23
-
24
-
25
-
26
-
27
-
28
-
29
-
30
-
31
-
32
-
33
-
34
-
35
-
36
-
37
-
 38
38 -
 39
39 -
 40
40 -
 41
41 -
 42
42 -
 43
43 -
 44
44 -
 45
45 -
 46
46 -
 47
47 -
 48
48 -
 49
49 -
 50
50 -
 51
51 -
 52
52 -
 53
53 -
 54
54 -
 55
55 -
 56
56 -
 57
57 -
 58
58 -
59
-
60
-
61
-
62
-
63
-
64
-
65
-
66
-
67
-
68
-
69
-
70
-
71
-
72
-
73
-
74
-
75
-
76
-
77
-
78
-
79
-
80
-
81
-
82
-
83
-
84
-
85
-
86
-
87
-
88
-
89
-
90
-
91
-
92
-
93
-
94
-
95
-
96
-
97
-
98
-
99
-
100
-
101
-
102
-
103
-
104
-
105
-
106
-
107
-
108
-
109
-
110
-
111
-
112
-
113
-
114
-
115
-
116
-
117
-
118
-
119
-
120
-
121
-
122
-
123
-
124
-
125
-
126
-
127
-
128
-
129
-
130
-
131
-
132
-
133
-
134
-
135
-
136
-
137
-
138
-
139
-
140
-
141
-
142
-
143
-
144
-
145
-
146
-
147
-
148
-
149
-
150
-
151
-
152
-
153
-
154
 |
 |

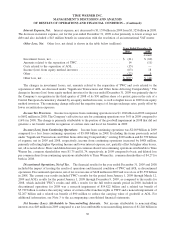
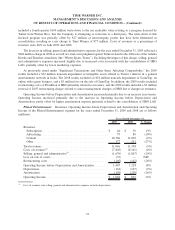
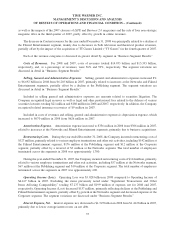
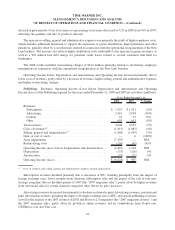
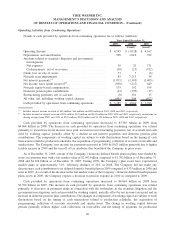
Corporate. Operating Loss before Depreciation and Amortization and Operating Loss of the Corporate
segment for the years ended December 31, 2009 and 2008 are as follows (millions):
2009 2008 % Change
Years Ended December 31,
Selling, general and administrative
(a)
......................... $ (325) $ (324) —
Restructuring costs ...................................... — (12) (100%)
Operating Loss before Depreciation and Amortization ............ (325) (336) (3%)
Depreciation ........................................... (40) (44) (9%)
Operating Loss ......................................... $ (365) $ (380) (4%)
(a)
Selling, general and administrative expenses exclude depreciation.
The 2008 results included $12 million of restructuring costs, due primarily to involuntary employee
terminations as a result of the Company’s cost savings initiatives at the Corporate segment.
Excluding the restructuring costs noted above, Operating Loss before Depreciation and Amortization for the
year ended December 31, 2009 was essentially flat compared to the prior year, reflecting higher pension expenses,
an increase in legal and other professional fees related to the defense of former employees in various lawsuits and an
increase in philanthropic contributions, offset by cost savings initiatives.
2008 vs. 2007
Consolidated Results
The following discussion provides an analysis of the Company’s results of operations and should be read in
conjunction with the accompanying consolidated statement of operations.
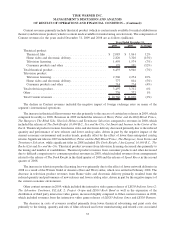
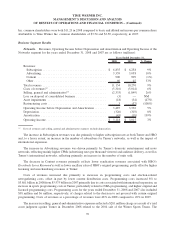
Revenues. The components of revenues are as follows (recast; millions):
2008 2007 % Change
Years Ended December 31,
Subscription ........................................ $ 8,397 $ 7,838 7%
Advertising......................................... 5,798 5,731 1%
Content ........................................... 11,435 11,709 (2%)
Other ............................................. 886 933 (5%)
Total revenues ...................................... $ 26,516 $ 26,211 1%
The increase in Subscription revenues for the year ended December 31, 2008 was primarily related to an
increase at the Networks segment, partly offset by a decline at the Publishing segment. The increase at the Networks
segment was due primarily to higher subscription rates at both Turner and HBO and, to a lesser extent, an increase in
the number of subscribers for Turner’s networks, as well as the impact of international expansion. The decline in
Subscription revenues at the Publishing segment was primarily due to decreases at IPC, resulting principally from
the impact of foreign exchange rates, lower revenues from domestic subscription sales and the impact of the sale of
four non-strategic magazine titles in the third quarter of 2007, partly offset by higher revenues from newsstand sales
for certain domestic magazine titles driven by price increases.
The increase in Advertising revenues for the year ended December 31, 2008 was primarily due to growth at the
Networks segment, partially offset by a decline at the Publishing segment. The increase at the Networks segment
was driven primarily by Turner’s domestic entertainment and news networks. The decrease in Advertising revenues
at the Publishing segment was due to declines in domestic print Advertising revenues, international print
Advertising revenues, including the impact of foreign exchange rates at IPC, and custom publishing revenues,
36
TIME WARNER INC.
MANAGEMENT’S DISCUSSION AND ANALYSIS
OF RESULTS OF OPERATIONS AND FINANCIAL CONDITION – (Continued)