Time Magazine 2009 Annual Report Download - page 43
Download and view the complete annual report
Please find page 43 of the 2009 Time Magazine annual report below. You can navigate through the pages in the report by either clicking on the pages listed below, or by using the keyword search tool below to find specific information within the annual report.-
 1
1 -
2
-
3
-
4
-
5
-
6
-
7
-
8
-
9
-
10
-
11
-
12
-
13
-
14
-
15
-
16
-
17
-
18
-
19
-
20
-
21
-
22
-
23
-
24
-
25
-
26
-
27
-
28
-
29
-
30
-
31
-
32
-
 33
33 -
 34
34 -
 35
35 -
 36
36 -
 37
37 -
 38
38 -
 39
39 -
 40
40 -
 41
41 -
 42
42 -
 43
43 -
 44
44 -
 45
45 -
 46
46 -
 47
47 -
 48
48 -
 49
49 -
 50
50 -
 51
51 -
 52
52 -
 53
53 -
54
-
55
-
56
-
57
-
58
-
59
-
60
-
61
-
62
-
63
-
64
-
65
-
66
-
67
-
68
-
69
-
70
-
71
-
72
-
73
-
74
-
75
-
76
-
77
-
78
-
79
-
80
-
81
-
82
-
83
-
84
-
85
-
86
-
87
-
88
-
89
-
90
-
91
-
92
-
93
-
94
-
95
-
96
-
97
-
98
-
99
-
100
-
101
-
102
-
103
-
104
-
105
-
106
-
107
-
108
-
109
-
110
-
111
-
112
-
113
-
114
-
115
-
116
-
117
-
118
-
119
-
120
-
121
-
122
-
123
-
124
-
125
-
126
-
127
-
128
-
129
-
130
-
131
-
132
-
133
-
134
-
135
-
136
-
137
-
138
-
139
-
140
-
141
-
142
-
143
-
144
-
145
-
146
-
147
-
148
-
149
-
150
-
151
-
152
-
153
-
154
 |
 |

2008 of which $39 million of income and a $1.251 billion loss, respectively, were attributable to discontinued
operations.
Net Income (Loss) Attributable to Time Warner Inc. shareholders. Net income attributable to Time Warner
Inc. common shareholders was $2.468 billion in 2009 compared to a loss of $13.402 billion in 2008. Basic and
diluted net income per common share attributable to Time Warner Inc. common shareholders were $2.08 and $2.07,
respectively, in 2009 compared to basic and diluted net loss per common share attributable to Time Warner Inc.
common shareholders of $11.23 for both in 2008.
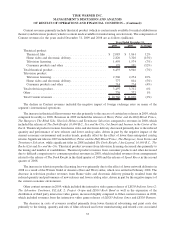
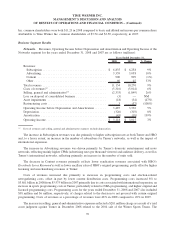
Business Segment Results
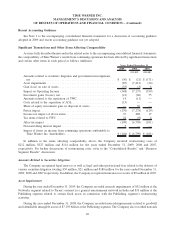
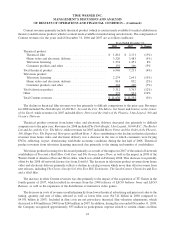
Networks. Revenues, Operating Income before Depreciation and Amortization and Operating Income of the
Networks segment for the years ended December 31, 2009 and 2008 are as follows (millions):
2009 2008 % Change
Years Ended December 31,
Revenues:
Subscription ....................................... $ 7,491 $ 6,835 10%
Advertising ....................................... 3,272 3,359 (3%)
Content . . ........................................ 813 900 (10%)
Other ............................................ 127 60 112%
Total revenues ....................................... 11,703 11,154 5%
Costs of revenues
(a)
................................... (5,594) (5,316) 5%
Selling, general and administrative
(a)
...................... (2,082) (2,333) (11%)
Loss on disposal of consolidated business ................... — (3) (100%)
Asset impairments .................................... (52) (18) 189%
Restructuring costs.................................... (8) 3 NM
Operating Income before Depreciation and Amortization........ 3,967 3,487 14%
Depreciation ........................................ (349) (326) 7%
Amortization ........................................ (73) (43) 70%
Operating Income .................................... $ 3,545 $ 3,118 14%
(a)
Costs of revenues and selling, general and administrative expenses exclude depreciation.
The increase in Subscription revenues was due primarily to higher subscription rates at both Turner and HBO
and international subscriber growth as well as the consolidation of HBO LAG, partially offset by the negative
impact of foreign exchange rates at Turner.
The decrease in Advertising revenues reflected decreases at Turner’s news networks, mainly due to audience
declines, in part tied to the impact of the 2008 election coverage, and weakened demand, as well as the negative
impact of foreign exchange rates at Turner’s international entertainment networks.
The decrease in Content revenues was due primarily to lower ancillary sales of HBO’s original programming,
partly offset by the effect of lower than anticipated home video returns of approximately $25 million.
Costs of revenues increased due to higher programming costs, partially offset by lower newsgathering costs,
primarily reflecting the absence of the prior year’s election-related newsgathering costs. Programming costs
increased 8% to $4.177 billion from $3.861 billion in 2008. The increase in programming costs was due primarily to
the impact of the consolidation of HBO LAG, higher expenses related to licensed programming at both Turner and
HBO and original programming at Turner, partially offset by lower sports programming expenses at Turner that
were primarily related to NBA programming. Licensed programming costs for the year ended December 31, 2009
31
TIME WARNER INC.
MANAGEMENT’S DISCUSSION AND ANALYSIS
OF RESULTS OF OPERATIONS AND FINANCIAL CONDITION – (Continued)