Time Magazine 2009 Annual Report Download - page 53
Download and view the complete annual report
Please find page 53 of the 2009 Time Magazine annual report below. You can navigate through the pages in the report by either clicking on the pages listed below, or by using the keyword search tool below to find specific information within the annual report.-
 1
1 -
2
-
3
-
4
-
5
-
6
-
7
-
8
-
9
-
10
-
11
-
12
-
13
-
14
-
15
-
16
-
17
-
18
-
19
-
20
-
21
-
22
-
23
-
24
-
25
-
26
-
27
-
28
-
29
-
30
-
31
-
32
-
33
-
34
-
35
-
36
-
37
-
38
-
39
-
40
-
41
-
42
-
 43
43 -
 44
44 -
 45
45 -
 46
46 -
 47
47 -
 48
48 -
 49
49 -
 50
50 -
 51
51 -
 52
52 -
 53
53 -
 54
54 -
 55
55 -
 56
56 -
 57
57 -
 58
58 -
 59
59 -
 60
60 -
 61
61 -
 62
62 -
 63
63 -
64
-
65
-
66
-
67
-
68
-
69
-
70
-
71
-
72
-
73
-
74
-
75
-
76
-
77
-
78
-
79
-
80
-
81
-
82
-
83
-
84
-
85
-
86
-
87
-
88
-
89
-
90
-
91
-
92
-
93
-
94
-
95
-
96
-
97
-
98
-
99
-
100
-
101
-
102
-
103
-
104
-
105
-
106
-
107
-
108
-
109
-
110
-
111
-
112
-
113
-
114
-
115
-
116
-
117
-
118
-
119
-
120
-
121
-
122
-
123
-
124
-
125
-
126
-
127
-
128
-
129
-
130
-
131
-
132
-
133
-
134
-
135
-
136
-
137
-
138
-
139
-
140
-
141
-
142
-
143
-
144
-
145
-
146
-
147
-
148
-
149
-
150
-
151
-
152
-
153
-
154
 |
 |

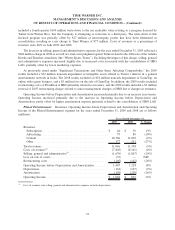
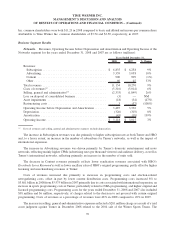
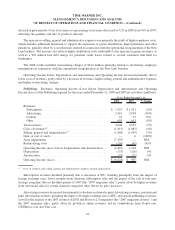
Content revenues primarily include theatrical product (which is content made available for initial exhibition in
theaters) and television product (which is content made available for initial airing on television). The components of
Content revenues for the years ended December 31, 2008 and 2007 are as follows (millions):
2008 2007 % Change
Years Ended December 31,
Theatrical product:
Theatrical film .................................... $ 1,861 $ 2,131 (13%)
Home video and electronic delivery ..................... 3,320 3,483 (5%)
Television licensing................................. 1,574 1,451 8%
Consumer products and other ......................... 191 166 15%
Total theatrical product ................................ 6,946 7,231 (4%)
Television product:
Television licensing................................. 2,274 2,691 (15%)
Home video and electronic delivery ..................... 814 832 (2%)
Consumer products and other ......................... 224 240 (7%)
Total television product................................ 3,312 3,763 (12%)
Other ............................................. 772 361 114%
Total Content revenues ................................ $ 11,030 $ 11,355 (3%)
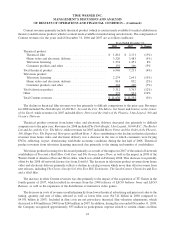
The decline in theatrical film revenues was due primarily to difficult comparisons to the prior year. Revenues
for 2008 included The Dark Knight,10,000 B.C.,Sex and the City: The Movie,Get Smart and Journey to the Center
of the Earth, while revenues for 2007 included Harry Potter and the Order of the Phoenix,I Am Legend,300 and
Ocean’s Thirteen.
Theatrical product revenues from home video and electronic delivery decreased due primarily to difficult
comparisons to the prior year. Revenues for 2008 included The Dark Knight,I Am Legend,10,000 B.C.,The Bucket
List and Sex and the City: The Movie, while revenues for 2007 included Harry Potter and the Order of the Phoenix,
300,Happy Feet,The Departed,Hairspray and Rush Hour 3. Also contributing to the decline in theatrical product
revenues from home video and electronic delivery was a decrease in the rate at which consumers were buying
DVDs, reflecting, in part, deteriorating worldwide economic conditions during the last half of 2008. Theatrical
product revenues from television licensing increased due primarily to the timing and number of availabilities.
Television product licensing fees decreased primarily as a result of the impact in 2007 of the initial off-network
availabilities of Two and a Half Men, Cold Case and The George Lopez Show, as well as the impact in 2008 of the
Writers Guild of America (East and West) strike, which was settled in February 2008. This decrease was partially
offset by the 2008 off-network license fees from Seinfeld. The decrease in television product revenues from home
video and electronic delivery primarily reflects a decline in catalog revenue which more than offsets revenue from
new releases, including The Closer,Gossip Girl,One Tree Hill,Terminator: The Sarah Connor Chronicles and Two
and a Half Men.
The increase in other Content revenues was due primarily to the impact of the acquisition of TT Games in the
fourth quarter of 2007, which resulted in revenues from the 2008 releases of LEGO Indiana Jones and LEGO
Batman, as well as the expansion of the distribution of interactive video games.
The decrease in costs of revenues resulted primarily from lower theatrical advertising and print costs due to the
timing, quantity and mix of films released as well as lower film costs ($4.741 billion in 2008 compared to
$4.931 billion in 2007). Included in film costs are net pre-release theatrical film valuation adjustments, which
decreased to $84 million in 2008 from $240 million in 2007. In addition, during the year ended December 31, 2008,
the Company recognized approximately $53 million in participation expense related to current claims on films
41
TIME WARNER INC.
MANAGEMENT’S DISCUSSION AND ANALYSIS
OF RESULTS OF OPERATIONS AND FINANCIAL CONDITION – (Continued)