Time Magazine 2009 Annual Report Download - page 42
Download and view the complete annual report
Please find page 42 of the 2009 Time Magazine annual report below. You can navigate through the pages in the report by either clicking on the pages listed below, or by using the keyword search tool below to find specific information within the annual report.-
 1
1 -
2
-
3
-
4
-
5
-
6
-
7
-
8
-
9
-
10
-
11
-
12
-
13
-
14
-
15
-
16
-
17
-
18
-
19
-
20
-
21
-
22
-
23
-
24
-
25
-
26
-
27
-
28
-
29
-
30
-
31
-
 32
32 -
 33
33 -
 34
34 -
 35
35 -
 36
36 -
 37
37 -
 38
38 -
 39
39 -
 40
40 -
 41
41 -
 42
42 -
 43
43 -
 44
44 -
 45
45 -
 46
46 -
 47
47 -
 48
48 -
 49
49 -
 50
50 -
 51
51 -
 52
52 -
53
-
54
-
55
-
56
-
57
-
58
-
59
-
60
-
61
-
62
-
63
-
64
-
65
-
66
-
67
-
68
-
69
-
70
-
71
-
72
-
73
-
74
-
75
-
76
-
77
-
78
-
79
-
80
-
81
-
82
-
83
-
84
-
85
-
86
-
87
-
88
-
89
-
90
-
91
-
92
-
93
-
94
-
95
-
96
-
97
-
98
-
99
-
100
-
101
-
102
-
103
-
104
-
105
-
106
-
107
-
108
-
109
-
110
-
111
-
112
-
113
-
114
-
115
-
116
-
117
-
118
-
119
-
120
-
121
-
122
-
123
-
124
-
125
-
126
-
127
-
128
-
129
-
130
-
131
-
132
-
133
-
134
-
135
-
136
-
137
-
138
-
139
-
140
-
141
-
142
-
143
-
144
-
145
-
146
-
147
-
148
-
149
-
150
-
151
-
152
-
153
-
154
 |
 |

Interest Expense, Net. Interest expense, net, decreased to $1.155 billion in 2009 from $1.325 billion in 2008.
The decrease in interest expense, net for the year ended December 31, 2009 is due primarily to lower average net
debt and also included a $43 million benefit in connection with the resolution of an international VAT matter.
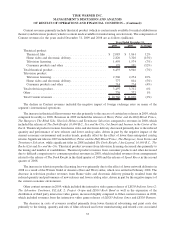
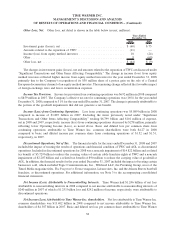
Other Loss, Net. Other loss, net detail is shown in the table below (millions):
2009 2008
Years Ended December 31,
(recast)
Investment losses, net.......................................... $ (21) $ (60)
Amounts related to the separation of TWC .......................... 14 (11)
Costs related to the separation of AOL ............................. (15) —
Income (loss) from equity method investees . . . ...................... (63) 18
Other...................................................... (22) 9
Other loss, net ............................................... $ (107) $ (44)
The changes in investment losses, net, amounts related to the separation of TWC and costs related to the
separation of AOL are discussed under “Significant Transactions and Other Items Affecting Comparability.” The
change in Income (loss) from equity method investees for the year ended December 31, 2009 was primarily due to
the Company’s recognition in the third quarter of 2008 of its $30 million share of a pretax gain on the sale of a
Central European documentary channel by an equity method investee, as well as higher losses in 2009 from equity
method investees. The remaining change reflected the negative impact of foreign exchange rates, partly offset by
lower securitization expenses.
Income Tax Provision. Income tax expense from continuing operations was $1.194 billion in 2009 compared
to $692 million in 2008. The Company’s effective tax rate for continuing operations was 36% in 2009 compared to
(16%) in 2008. The change is primarily attributable to the portion of the goodwill impairment in 2008 that did not
generate a tax benefit and the recognition of certain state and local tax benefits in 2009.
Income (Loss) from Continuing Operations. Income from continuing operations was $2.089 billion in 2009
compared to a loss from continuing operations of $5.089 billion in 2008. Excluding the items previously noted
under “Significant Transactions and Other Items Affecting Comparability” totaling $109 million and $6.799 billion
of expense, net in 2009 and 2008, respectively, income from continuing operations increased by $488 million,
primarily reflecting higher Operating Income and lower interest expense, net, partially offset by higher other losses,
net, all as noted above. Basic and diluted income per common share from continuing operations attributable to Time
Warner Inc. common shareholders were $1.75 and $1.74, respectively, in 2009 compared to basic and diluted loss
per common share from continuing operations attributable to Time Warner Inc. common shareholders of $4.27 for
both in 2008.
Discontinued Operations, Net of Tax. The financial results for the year ended December 31, 2009 and 2008
included the impact of treating the results of operations and financial condition of TWC and AOL as discontinued
operations. Discontinued operations, net of tax was income of $428 million in 2009 and was a loss of $9.559 billion
in 2008. The current year results included TWC’s results for the period from January 1, 2009 through March 12,
2009 and AOL’s results for the period January 1, 2009 through December 9, 2009, as compared to the results for
2008, which included TWC’s results and AOL’s results for the full twelve-month period in 2008. Included in
discontinued operations for 2008 was a noncash impairment of $14.822 billion and a related tax benefit of
$5.729 billion to reduce the carrying values of certain cable franchise rights at TWC and a noncash impairment of
$2.207 billion and a related tax benefit of $90 million to reduce the carrying value of goodwill at AOL. For
additional information, see Note 3 to the accompanying consolidated financial statements.
Net Income (Loss) Attributable to Noncontrolling Interests. Net income attributable to noncontrolling
interests was $49 million in 2009 compared to a net loss attributable to noncontrolling interests of $1.246 billion in
30
TIME WARNER INC.
MANAGEMENT’S DISCUSSION AND ANALYSIS
OF RESULTS OF OPERATIONS AND FINANCIAL CONDITION – (Continued)