Time Magazine 2009 Annual Report Download - page 129
Download and view the complete annual report
Please find page 129 of the 2009 Time Magazine annual report below. You can navigate through the pages in the report by either clicking on the pages listed below, or by using the keyword search tool below to find specific information within the annual report.-
 1
1 -
2
-
3
-
4
-
5
-
6
-
7
-
8
-
9
-
10
-
11
-
12
-
13
-
14
-
15
-
16
-
17
-
18
-
19
-
20
-
21
-
22
-
23
-
24
-
25
-
26
-
27
-
28
-
29
-
30
-
31
-
32
-
33
-
34
-
35
-
36
-
37
-
38
-
39
-
40
-
41
-
42
-
43
-
44
-
45
-
46
-
47
-
48
-
49
-
50
-
51
-
52
-
53
-
54
-
55
-
56
-
57
-
58
-
59
-
60
-
61
-
62
-
63
-
64
-
65
-
66
-
67
-
68
-
69
-
70
-
71
-
72
-
73
-
74
-
75
-
76
-
77
-
78
-
79
-
80
-
81
-
82
-
83
-
84
-
85
-
86
-
87
-
88
-
89
-
90
-
91
-
92
-
93
-
94
-
95
-
96
-
97
-
98
-
99
-
100
-
101
-
102
-
103
-
104
-
105
-
106
-
107
-
108
-
109
-
110
-
111
-
112
-
113
-
114
-
115
-
116
-
117
-
118
-
 119
119 -
 120
120 -
 121
121 -
 122
122 -
 123
123 -
 124
124 -
 125
125 -
 126
126 -
 127
127 -
 128
128 -
 129
129 -
 130
130 -
 131
131 -
 132
132 -
 133
133 -
 134
134 -
 135
135 -
 136
136 -
 137
137 -
 138
138 -
 139
139 -
140
-
141
-
142
-
143
-
144
-
145
-
146
-
147
-
148
-
149
-
150
-
151
-
152
-
153
-
154
 |
 |

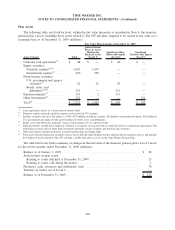
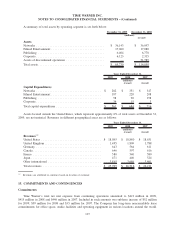
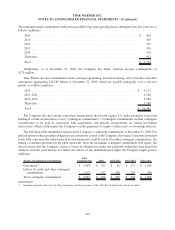
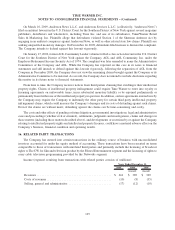
A summary of total assets by operating segment is set forth below:
December 31, 2009 December 31, 2008
(millions)
(recast)
Assets
Networks ......................................... $ 36,143 $ 36,097
Filmed Entertainment . . .............................. 17,060 17,080
Publishing ........................................ 6,404 6,778
Corporate ......................................... 6,123 2,315
Assets of discontinued operations ....................... — 51,789
Total assets ........................................ $ 65,730 $ 114,059
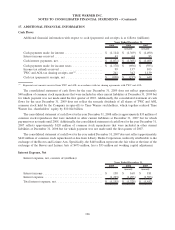
2009 2008 2007
Years Ended December 31,
(millions)
(recast) (recast)
Capital Expenditures
Networks ....................................... $ 282 $ 351 $ 347
Filmed Entertainment .............................. 187 228 208
Publishing . . . ................................... 58 90 158
Corporate ....................................... 34 15 3
Total capital expenditures ........................... $ 561 $ 684 $ 716
Assets located outside the United States, which represent approximately 6% of total assets at December 31,
2009, are not material. Revenues in different geographical areas are as follows:
2009 2008 2007
Years Ended December 31,
(millions)
(recast) (recast)
Revenues
(a)
United States .................................... $ 18,085 $ 18,880 $ 18,631
United Kingdom .................................. 1,495 1,809 1,788
Germany . . ..................................... 643 564 611
Canada ......................................... 646 597 616
France ......................................... 580 540 580
Japan .......................................... 471 440 524
Other international ................................ 3,865 3,686 3,461
Total revenues ................................... $ 25,785 $ 26,516 $ 26,211
(a)
Revenues are attributed to countries based on location of customer.
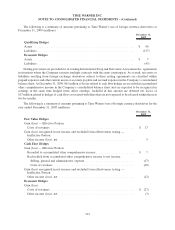
15. COMMITMENTS AND CONTINGENCIES
Commitments
Time Warner’s total net rent expense from continuing operations amounted to $421 million in 2009,
$415 million in 2008 and $446 million in 2007. Included in such amounts was sublease income of $52 million
for 2009, $59 million for 2008 and $35 million for 2007. The Company has long-term noncancelable lease
commitments for office space, studio facilities and operating equipment in various locations around the world.
117
TIME WARNER INC.
NOTES TO CONSOLIDATED FINANCIAL STATEMENTS – (Continued)