Time Magazine 2009 Annual Report Download - page 144
Download and view the complete annual report
Please find page 144 of the 2009 Time Magazine annual report below. You can navigate through the pages in the report by either clicking on the pages listed below, or by using the keyword search tool below to find specific information within the annual report.-
 1
1 -
2
-
3
-
4
-
5
-
6
-
7
-
8
-
9
-
10
-
11
-
12
-
13
-
14
-
15
-
16
-
17
-
18
-
19
-
20
-
21
-
22
-
23
-
24
-
25
-
26
-
27
-
28
-
29
-
30
-
31
-
32
-
33
-
34
-
35
-
36
-
37
-
38
-
39
-
40
-
41
-
42
-
43
-
44
-
45
-
46
-
47
-
48
-
49
-
50
-
51
-
52
-
53
-
54
-
55
-
56
-
57
-
58
-
59
-
60
-
61
-
62
-
63
-
64
-
65
-
66
-
67
-
68
-
69
-
70
-
71
-
72
-
73
-
74
-
75
-
76
-
77
-
78
-
79
-
80
-
81
-
82
-
83
-
84
-
85
-
86
-
87
-
88
-
89
-
90
-
91
-
92
-
93
-
94
-
95
-
96
-
97
-
98
-
99
-
100
-
101
-
102
-
103
-
104
-
105
-
106
-
107
-
108
-
109
-
110
-
111
-
112
-
113
-
114
-
115
-
116
-
117
-
118
-
119
-
120
-
121
-
122
-
123
-
124
-
125
-
126
-
127
-
128
-
129
-
130
-
131
-
132
-
133
-
 134
134 -
 135
135 -
 136
136 -
 137
137 -
 138
138 -
 139
139 -
 140
140 -
 141
141 -
 142
142 -
 143
143 -
 144
144 -
 145
145 -
 146
146 -
 147
147 -
 148
148 -
 149
149 -
 150
150 -
 151
151 -
 152
152 -
 153
153 -
 154
154
 |
 |

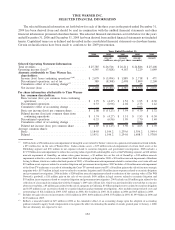
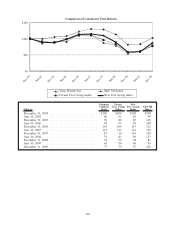
TIME WARNER INC.
SELECTED FINANCIAL INFORMATION
The selected financial information set forth below for each of the three years in the period ended December 31,
2009 has been derived from and should be read in conjunction with the audited financial statements and other
financial information presented elsewhere herein. The selected financial information set forth below for the years
ended December 31, 2006 and December 31, 2005 has been derived from audited financial statements not included
herein. Capitalized terms are as defined and described in the consolidated financial statements or elsewhere herein.
Certain reclassifications have been made to conform to the 2009 presentation.
2009 2008 2007 2006 2005
Years Ended December 31,
(recast) (recast) (recast) (recast)
(millions, except per share amounts)
Selected Operating Statement Information:
Total revenues . . ............................. $25,785 $ 26,516 $ 26,211 $ 24,886 $ 25,408
Operating income (loss)
(a)
...................... 4,545 (3,028) 4,167 3,229 1,049
Amounts attributable to Time Warner Inc.
shareholders:
Income (loss) from continuing operations
(a)(b)
....... $ 2,079 $ (5,094) $ 1,889 $ 2,718 $ 471
Discontinued operations, net of tax . . ............ 389 (8,308) 2,498 3,809 2,200
Cumulative effect of accounting change
(c)
......... — — — 25 —
Net income (loss) ........................... $ 2,468 $(13,402) $ 4,387 $ 6,552 $ 2,671
Per share information attributable to Time Warner
Inc. common shareholders:
Basic income (loss) per common from continuing
operations . ............................. $ 1.75 $ (4.27) $ 1.52 $ 1.95 $ 0.30
Discontinued operations ...................... 0.33 (6.96) 2.02 2.73 1.42
Cumulative effect of accounting change ........... — — — 0.02 —
Basic net income (loss) per common share . . ....... $ 2.08 $ (11.23) $ 3.54 $ 4.70 $ 1.72
Diluted income (loss) per common share from
continuing operations ...................... $ 1.74 $ (4.27) $ 1.51 $ 1.93 $ 0.30
Discontinued operations ...................... 0.33 (6.96) 1.99 2.70 1.40
Cumulative effect of accounting change ........... — — — 0.02 —
Diluted net income (loss) per common share ....... $ 2.07 $ (11.23) $ 3.50 $ 4.65 $ 1.70
Average common shares:
Basic . . .................................. 1,184.0 1,194.2 1,239.6 1,394.2 1,549.4
Diluted .................................. 1,195.1 1,194.2 1,254.0 1,408.3 1,570.0
(a)
2009 includes a $52 million noncash impairment of intangible assets related to Turner’s interest in a general entertainment network in India,
a $33 million loss on the sale of Warner Bros.’ Italian cinema assets, a $33 million noncash impairment of certain fixed assets at the
Publishing segment and $30 million in net expenses related to securities litigation and government investigations. 2008 includes a
$7.139 billion noncash impairment to reduce the carrying value of goodwill and intangible assets at the Publishing segment, an $18 million
noncash impairment of GameTap, an online video game business, a $3 million loss on the sale of GameTap, a $30 million noncash
impairment related to a sub-lease with a tenant that filed for bankruptcy in September 2008, a $21 million noncash impairment of Southern
Living At Home, which was sold in the third quarter of 2009, a $5 million noncash impairment related to certain other asset write-offs and
$21 million in net expenses related to securities litigation and government investigations. 2007 includes a $34 million noncash impairment
of the Court TV tradename as a result of rebranding the Court TV network name to truTV, a $6 million gain on the sale of four non-strategic
magazine titles, $153 million in legal reserves related to securities litigation and $18 million in net expenses related to securities litigation
and government investigations. 2006 includes a $200 million noncash impairment related to reduction of the carrying value of The WB
Network’s goodwill, a $20 million gain on the sale of two aircraft, $650 million in legal reserves related to securities litigation and
$55 million in net expenses related to securities litigation and government investigations. 2005 includes an $8 million gain related to the
collection of a loan made in conjunction with the Company’s 2003 sale of Time Life, which was previously fully reserved due to concerns
about recoverability, a $5 million gain related to the sale of a property in California, $3 billion in legal reserves related to securities litigation
and $135 million in net recoveries related to securities litigation and government investigations. Also includes merger-related costs and
restructurings of $212 million in 2009, $327 million in 2008, $114 million in 2007, $122 million in 2006 and $65 million in 2005.
(b)
Includes net gains (losses) on investments of $21 million in 2009, $(60) million in 2008, $75 million in 2007, $1.039 billion in 2006 and
$127 million in 2005.
(c)
Reflects a noncash benefit of $25 million in 2006 as the cumulative effect of an accounting change upon the adoption of accounting
guidance related to equity based compensation to recognize the effect of estimating the number of awards granted prior to January 1, 2006
that are ultimately not expected to vest.
132