Time Magazine 2009 Annual Report Download - page 149
Download and view the complete annual report
Please find page 149 of the 2009 Time Magazine annual report below. You can navigate through the pages in the report by either clicking on the pages listed below, or by using the keyword search tool below to find specific information within the annual report.-
 1
1 -
2
-
3
-
4
-
5
-
6
-
7
-
8
-
9
-
10
-
11
-
12
-
13
-
14
-
15
-
16
-
17
-
18
-
19
-
20
-
21
-
22
-
23
-
24
-
25
-
26
-
27
-
28
-
29
-
30
-
31
-
32
-
33
-
34
-
35
-
36
-
37
-
38
-
39
-
40
-
41
-
42
-
43
-
44
-
45
-
46
-
47
-
48
-
49
-
50
-
51
-
52
-
53
-
54
-
55
-
56
-
57
-
58
-
59
-
60
-
61
-
62
-
63
-
64
-
65
-
66
-
67
-
68
-
69
-
70
-
71
-
72
-
73
-
74
-
75
-
76
-
77
-
78
-
79
-
80
-
81
-
82
-
83
-
84
-
85
-
86
-
87
-
88
-
89
-
90
-
91
-
92
-
93
-
94
-
95
-
96
-
97
-
98
-
99
-
100
-
101
-
102
-
103
-
104
-
105
-
106
-
107
-
108
-
109
-
110
-
111
-
112
-
113
-
114
-
115
-
116
-
117
-
118
-
119
-
120
-
121
-
122
-
123
-
124
-
125
-
126
-
127
-
128
-
129
-
130
-
131
-
132
-
133
-
134
-
135
-
136
-
137
-
138
-
 139
139 -
 140
140 -
 141
141 -
 142
142 -
 143
143 -
 144
144 -
 145
145 -
 146
146 -
 147
147 -
 148
148 -
 149
149 -
 150
150 -
 151
151 -
 152
152 -
 153
153 -
 154
154
 |
 |
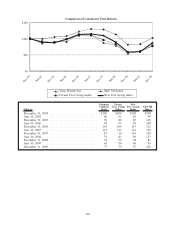
COMPARISON OF CUMULATIVE TOTAL RETURNS
The chart below compares the performance of the Company’s Common Stock with the performance of the S&P
500 Index and two peer group indices (consisting of the Former Peer Group Index and the New Peer Group Index)
by measuring the changes in common stock prices from December 31, 2004, plus reinvested dividends and
distributions through 2009. In accordance with SEC rules, the Company created the Former Peer Group Index and
the New Peer Group Index with which to compare its stock performance because there is not a relevant published
industry or line-of-business index.
The common stock of the following companies is included in the Former Peer Group Index: Cablevision
Systems Corporation (Class A), CBS Corporation (Class B), Comcast Corporation (Class A), Meredith
Corporation, News Corporation (Class A), Viacom Inc. (Class B) (“New Viacom”), The Walt Disney
Company, and Yahoo! Inc.
Following the separations of Time Warner Cable Inc. and AOL Inc. from the Company in 2009, the Company
re-evaluated its peer group index and created the New Peer Group Index consisting of the common stock of the
following companies: CBS Corporation (Class B), News Corporation (Class A), New Viacom and The Walt Disney
Company. New Viacom was created on December 31, 2005 by the separation of the company formerly known as
Viacom Inc. into two publicly held companies, CBS Corporation and New Viacom. New Viacom is included in both
the Former Peer Group Index and the New Peer Group Index from January 3, 2006, the date on which New Viacom’s
Class B common stock began to trade publicly. CBS Corporation is included in both the Former Peer Group Index
and the New Peer Group Index for all periods.
The New Peer Group Index reflects the Company’s selection of media and entertainment companies that have
lines of business similar to its own. Cablevision Systems Corporation, Comcast Corporation and Yahoo! Inc. were
not included in the New Peer Group Index since the size and mix of their businesses were no longer comparable to
the Company following the separations of Time Warner Cable Inc. and AOL Inc. Meredith Corporation was not
included in the New Peer Group Index as it is not comparable to the Company in terms of size and mix of businesses.
The chart assumes $100 was invested on December 31, 2004 in each of the Company’s Common Stock, the
S&P 500 Index, the Former Peer Group Index and the New Peer Group Index and reflects reinvestment of dividends
and distributions on a monthly basis and quarterly market capitalization weighting. The Company began paying a
quarterly dividend of $0.15 per share commencing with the third quarter of 2005 through the second quarter of
2006. The Company increased the dividend and paid a quarterly dividend of $0.165 per share commencing with the
third quarter of 2006 through the second quarter of 2007. The Company further increased the dividend and paid a
quarterly dividend of $0.1875 per share commencing with the third quarter of 2007 through the last quarter of 2009.
The per share dividend amounts above reflect adjustments for the 1-for-3 reverse stock split of the Company’s
Common Stock on March 27, 2009.
137