Time Magazine 2009 Annual Report Download - page 51
Download and view the complete annual report
Please find page 51 of the 2009 Time Magazine annual report below. You can navigate through the pages in the report by either clicking on the pages listed below, or by using the keyword search tool below to find specific information within the annual report.-
 1
1 -
2
-
3
-
4
-
5
-
6
-
7
-
8
-
9
-
10
-
11
-
12
-
13
-
14
-
15
-
16
-
17
-
18
-
19
-
20
-
21
-
22
-
23
-
24
-
25
-
26
-
27
-
28
-
29
-
30
-
31
-
32
-
33
-
34
-
35
-
36
-
37
-
38
-
39
-
40
-
 41
41 -
 42
42 -
 43
43 -
 44
44 -
 45
45 -
 46
46 -
 47
47 -
 48
48 -
 49
49 -
 50
50 -
 51
51 -
 52
52 -
 53
53 -
 54
54 -
 55
55 -
 56
56 -
 57
57 -
 58
58 -
 59
59 -
 60
60 -
 61
61 -
62
-
63
-
64
-
65
-
66
-
67
-
68
-
69
-
70
-
71
-
72
-
73
-
74
-
75
-
76
-
77
-
78
-
79
-
80
-
81
-
82
-
83
-
84
-
85
-
86
-
87
-
88
-
89
-
90
-
91
-
92
-
93
-
94
-
95
-
96
-
97
-
98
-
99
-
100
-
101
-
102
-
103
-
104
-
105
-
106
-
107
-
108
-
109
-
110
-
111
-
112
-
113
-
114
-
115
-
116
-
117
-
118
-
119
-
120
-
121
-
122
-
123
-
124
-
125
-
126
-
127
-
128
-
129
-
130
-
131
-
132
-
133
-
134
-
135
-
136
-
137
-
138
-
139
-
140
-
141
-
142
-
143
-
144
-
145
-
146
-
147
-
148
-
149
-
150
-
151
-
152
-
153
-
154
 |
 |

Inc. common shareholders were both $11.23 in 2008 compared to basic and diluted net income per common share
attributable to Time Warner Inc. common shareholders of $3.54 and $3.50, respectively, in 2007.
Business Segment Results
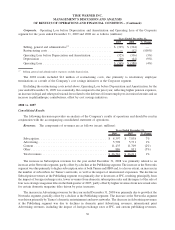
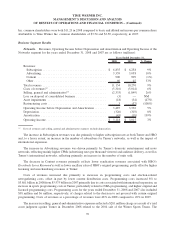
Networks. Revenues, Operating Income before Depreciation and Amortization and Operating Income of the
Networks segment for the years ended December 31, 2008 and 2007 are as follows (millions):
2008 2007 % Change
Years Ended December 31,
Revenues:
Subscription ...................................... $ 6,835 $ 6,258 9%
Advertising ....................................... 3,359 3,058 10%
Content ......................................... 900 909 (1%)
Other ........................................... 60 45 33%
Total revenues ...................................... 11,154 10,270 9%
Costs of revenues
(a)
.................................. (5,316) (5,014) 6%
Selling, general and administrative
(a)
...................... (2,333) (1,849) 26%
Loss on disposal of consolidated business .................. (3) — NM
Asset impairments ................................... (18) (34) (47%)
Restructuring costs ................................... 3 (37) (108%)
Operating Income before Depreciation and Amortization ....... 3,487 3,336 5%
Depreciation ........................................ (326) (303) 8%
Amortization ....................................... (43) (18) 139%
Operating Income .................................... $ 3,118 $ 3,015 3%
(a)
Costs of revenues and selling, general and administrative expenses exclude depreciation.
The increase in Subscription revenues was due primarily to higher subscription rates at both Turner and HBO
and, to a lesser extent, an increase in the number of subscribers for Turner’s networks, as well as the impact of
international expansion.
The increase in Advertising revenues was driven primarily by Turner’s domestic entertainment and news
networks, reflecting mainly higher CPMs (advertising rates per thousand viewers) and audience delivery, as well as
Turner’s international networks, reflecting primarily an increase in the number of units sold.
The decrease in Content revenues primarily reflects lower syndication revenues associated with HBO’s
Everybody Loves Raymond as well as lower ancillary sales of HBO’s original programming, partly offset by higher
licensing and merchandising revenues at Turner.
Costs of revenues increased due primarily to increases in programming costs and election-related
newsgathering costs, offset in part by lower content distribution costs. Programming costs increased 8% to
$3.861 billion in 2008 from $3.575 billion in 2007 primarily due to costs associated with international expansion, an
increase in sports programming costs at Turner, particularly related to NBA programming, and higher original and
licensed programming costs. Programming costs for the years ended December 31, 2008 and 2007 also included
$38 million and $6 million, respectively, of charges related to the decision to not proceed with certain original
programming. Costs of revenues as a percentage of revenues were 48% in 2008 compared to 49% in 2007.
The increase in selling, general and administrative expenses reflected a $281 million charge as a result of a trial
court judgment against Turner in December 2008 related to the 2004 sale of the Winter Sports Teams. The
39
TIME WARNER INC.
MANAGEMENT’S DISCUSSION AND ANALYSIS
OF RESULTS OF OPERATIONS AND FINANCIAL CONDITION – (Continued)