Time Magazine 2009 Annual Report Download - page 58
Download and view the complete annual report
Please find page 58 of the 2009 Time Magazine annual report below. You can navigate through the pages in the report by either clicking on the pages listed below, or by using the keyword search tool below to find specific information within the annual report.-
 1
1 -
2
-
3
-
4
-
5
-
6
-
7
-
8
-
9
-
10
-
11
-
12
-
13
-
14
-
15
-
16
-
17
-
18
-
19
-
20
-
21
-
22
-
23
-
24
-
25
-
26
-
27
-
28
-
29
-
30
-
31
-
32
-
33
-
34
-
35
-
36
-
37
-
38
-
39
-
40
-
41
-
42
-
43
-
44
-
45
-
46
-
47
-
 48
48 -
 49
49 -
 50
50 -
 51
51 -
 52
52 -
 53
53 -
 54
54 -
 55
55 -
 56
56 -
 57
57 -
 58
58 -
 59
59 -
 60
60 -
 61
61 -
 62
62 -
 63
63 -
 64
64 -
 65
65 -
 66
66 -
 67
67 -
 68
68 -
69
-
70
-
71
-
72
-
73
-
74
-
75
-
76
-
77
-
78
-
79
-
80
-
81
-
82
-
83
-
84
-
85
-
86
-
87
-
88
-
89
-
90
-
91
-
92
-
93
-
94
-
95
-
96
-
97
-
98
-
99
-
100
-
101
-
102
-
103
-
104
-
105
-
106
-
107
-
108
-
109
-
110
-
111
-
112
-
113
-
114
-
115
-
116
-
117
-
118
-
119
-
120
-
121
-
122
-
123
-
124
-
125
-
126
-
127
-
128
-
129
-
130
-
131
-
132
-
133
-
134
-
135
-
136
-
137
-
138
-
139
-
140
-
141
-
142
-
143
-
144
-
145
-
146
-
147
-
148
-
149
-
150
-
151
-
152
-
153
-
154
 |
 |

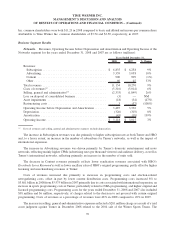
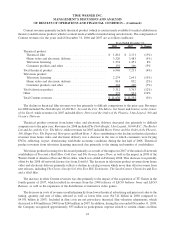
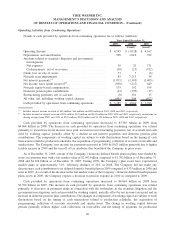
Operating Activities from Continuing Operations
Details of cash provided by operations from continuing operations are as follows (millions):
2009 2008 2007
Years Ended December 31,
(recast) (recast)
Operating Income..................................... $ 4,545 $ (3,028) $ 4,167
Depreciation and amortization ........................... 998 1,026 932
Amounts related to securities litigation and government
investigations:
Net expenses ...................................... 30 21 171
Cash payments, net of recoveries ....................... (30) (21) (912)
(Gain) loss on sale of assets . . ........................... 33 3 (6)
Noncash asset impairments . . . ........................... 85 7,213 34
Net interest payments
(a)
................................ (1,071) (1,305) (1,405)
Net income taxes (paid) received
(b)
........................ (838) (217) 649
Noncash equity-based compensation ....................... 175 192 195
Domestic pension plan contributions ....................... (43) (395) (17)
Restructuring payments, net of accruals .................... (8) 181 15
All other, net, including working capital changes ............. (491) 394 (427)
Cash provided by operations from continuing operations ........ $ 3,385 $ 4,064 $ 3,396
(a)
Includes interest income received of $43 million, $64 million and $85 million in 2009, 2008 and 2007, respectively.
(b)
Includes income tax refunds received of $99 million, $137 million and $103 million in 2009, 2008 and 2007, respectively, and income tax
sharing receipts from TWC and AOL of $241 million, $342 million and $1.139 billion in 2009, 2008 and 2007, respectively.
Cash provided by operations from continuing operations decreased to $3.385 billion in 2009 from
$4.064 billion in 2008. The decrease in cash provided by operations from continuing operations was related
primarily to an increase in net income taxes paid, an increase in restructuring payments, net of accruals and cash
used by working capital, partially offset by a decline in net interest payments and domestic pension plan
contributions. The components of working capital are subject to wide fluctuations based on the timing of cash
transactions related to production schedules, the acquisition of programming, collection of accounts receivable and
similar items. The Company’s net income tax payments increased in 2009 by $621 million primarily due to higher
taxable income in 2009 and the run-off of tax attributes that benefitted the Company in prior years.
As of December 31, 2009, certain of the Company’s domestic defined benefit pension plans were funded by
assets in a pension trust with a fair market value of $2.092 billion compared to $1.702 billion as of December 31,
2008 and $2.168 billion as of December 31, 2007. During 2009, the Company’s plan assets have experienced
market gains of approximately 31%, following declines of 34% in 2008. The Company did not make any
discretionary cash contributions to its defined domestic benefit plans in 2009 compared to $375 million in 2008 and
none in 2007. As a result of the increase in the fair market value of the Company’s domestic defined benefit pension
plans assets in 2009, the Company expects a decrease in pension expense in 2010 as compared to 2009.
Cash provided by operations from continuing operations increased to $4.064 billion in 2008 from
$3.396 billion in 2007. The increase in cash provided by operations from continuing operations was related
primarily to decreases in payments made in connection with the settlements in the securities litigation and the
government investigations and cash provided by working capital, partially offset by net income taxes paid and an
increase in domestic pension plan contributions. The changes in components of working capital are subject to wide
fluctuations based on the timing of cash transactions related to production schedules, the acquisition of
programming, collection of accounts receivable and similar items. The change in working capital between
periods primarily reflects higher cash collections on receivables and the timing of payments for production
46
TIME WARNER INC.
MANAGEMENT’S DISCUSSION AND ANALYSIS
OF RESULTS OF OPERATIONS AND FINANCIAL CONDITION – (Continued)